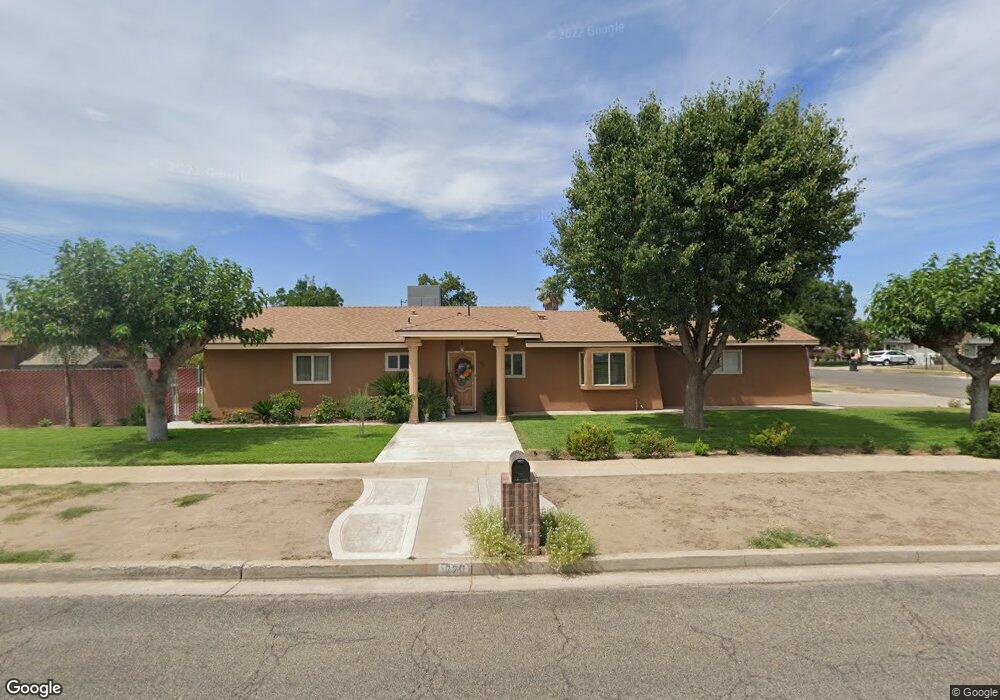
720 E Elm Ave Tulare, CA 93274
Tulare Southeast NeighborhoodEstimated Value: $241,000 - $326,900
3
Beds
3
Baths
1,651
Sq Ft
$173/Sq Ft
Est. Value
About This Home
This home is located at 720 E Elm Ave, Tulare, CA 93274 and is currently estimated at $285,975, approximately $173 per square foot. 720 E Elm Ave is a home located in Tulare County with nearby schools including Lincoln Elementary School, Cherry Avenue Middle School, and Tulare Union High School.
Ownership History
Date
Name
Owned For
Owner Type
Purchase Details
Closed on
Nov 17, 2004
Sold by
Yniguez Jose A
Bought by
Yniguez Jose A and Yniguez Angelica
Current Estimated Value
Home Financials for this Owner
Home Financials are based on the most recent Mortgage that was taken out on this home.
Original Mortgage
$65,000
Interest Rate
5.72%
Mortgage Type
Stand Alone Refi Refinance Of Original Loan
Create a Home Valuation Report for This Property
The Home Valuation Report is an in-depth analysis detailing your home's value as well as a comparison with similar homes in the area
Home Values in the Area
Average Home Value in this Area
Purchase History
| Date | Buyer | Sale Price | Title Company |
|---|---|---|---|
| Yniguez Jose A | -- | Fidelity National Title Co |
Source: Public Records
Mortgage History
| Date | Status | Borrower | Loan Amount |
|---|---|---|---|
| Closed | Yniguez Jose A | $65,000 |
Source: Public Records
Tax History
| Year | Tax Paid | Tax Assessment Tax Assessment Total Assessment is a certain percentage of the fair market value that is determined by local assessors to be the total taxable value of land and additions on the property. | Land | Improvement |
|---|---|---|---|---|
| 2025 | $1,476 | $135,581 | $23,913 | $111,668 |
| 2024 | $1,476 | $132,924 | $23,445 | $109,479 |
| 2023 | $1,438 | $130,319 | $22,986 | $107,333 |
| 2022 | $1,396 | $127,765 | $22,536 | $105,229 |
| 2021 | $1,378 | $125,260 | $22,094 | $103,166 |
| 2020 | $1,401 | $123,975 | $21,867 | $102,108 |
| 2019 | $1,437 | $121,544 | $21,438 | $100,106 |
| 2018 | $1,413 | $119,161 | $21,018 | $98,143 |
| 2017 | $1,317 | $116,825 | $20,606 | $96,219 |
| 2016 | $1,257 | $114,534 | $20,202 | $94,332 |
| 2015 | $1,194 | $108,000 | $27,000 | $81,000 |
| 2014 | $1,194 | $109,000 | $27,000 | $82,000 |
Source: Public Records
Map
Nearby Homes
- 1695 Fantail St
- 220 S O St
- 0 Spruce St S Unit 239148
- 0 Spruce St S Unit 233400
- 1026 E Tulare Ave
- 240 W Vetter
- 736 S Spruce St
- 639 E San Joaquin Ave
- 202 N L St
- 980 S Spruce St
- 1453 E Sonora Ave
- 1214 S Spruce St
- 1 Spruce St
- 1483 E Bardsley Ave
- 2838 Hidden Cove
- 876 Cardoza Dr
- 1533 Etna Dr
- 320 N Blackstone St Unit 14
- 421 S Laspina St
- 316 S D St
Your Personal Tour Guide
Ask me questions while you tour the home.