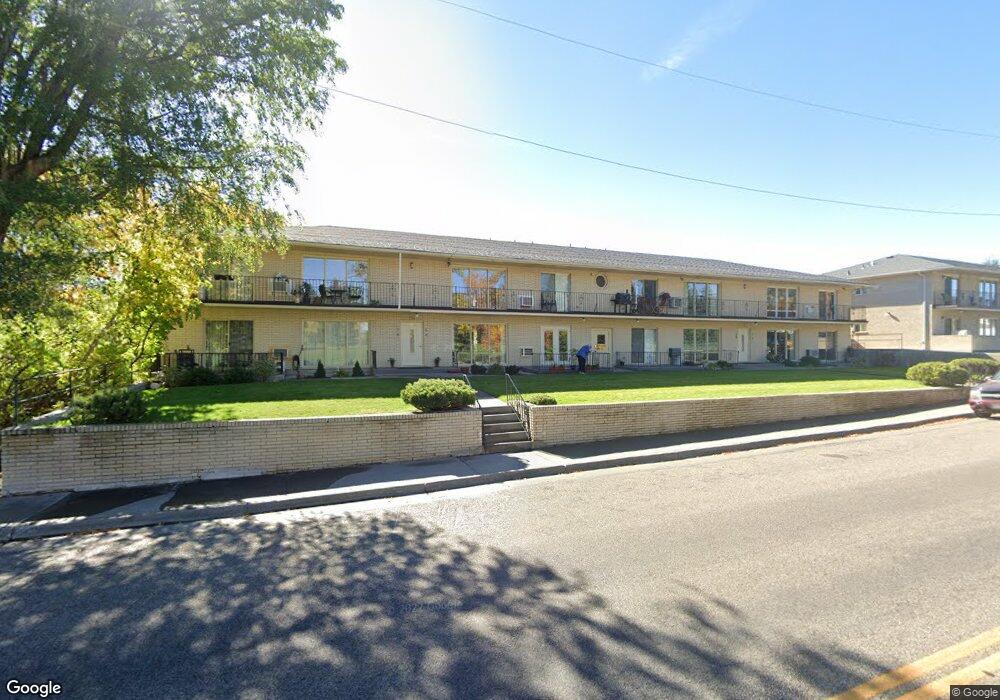
720 E Elva St Unit 8 Idaho Falls, ID 83401
Estimated Value: $207,000 - $224,000
2
Beds
1
Bath
1,198
Sq Ft
$181/Sq Ft
Est. Value
About This Home
This home is located at 720 E Elva St Unit 8, Idaho Falls, ID 83401 and is currently estimated at $216,998, approximately $181 per square foot. 720 E Elva St Unit 8 is a home located in Bonneville County with nearby schools including Dora Erickson Elementary School, Taylorview Middle School, and Idaho Falls Senior High School.
Ownership History
Date
Name
Owned For
Owner Type
Purchase Details
Closed on
Apr 11, 2016
Sold by
Cromwell Jake Joseph and Cromwell Rachel Anna
Bought by
Simmons Jacob J and Simmons Christina A
Current Estimated Value
Purchase Details
Closed on
Feb 1, 2013
Sold by
Gvc Family Llc
Bought by
Cromwell Jake Joseph and Cromwell Rachel Anna
Home Financials for this Owner
Home Financials are based on the most recent Mortgage that was taken out on this home.
Original Mortgage
$79,000
Interest Rate
3.32%
Mortgage Type
New Conventional
Purchase Details
Closed on
Sep 26, 2012
Sold by
Croft Dane E and Croft Shalina
Bought by
Gvc Family Llc
Purchase Details
Closed on
Jun 23, 2005
Sold by
Miller Jerry R
Bought by
Nelson Steven Craig
Purchase Details
Closed on
May 23, 2005
Sold by
Estate Of Joan B Miller
Bought by
Miller Jerry R
Create a Home Valuation Report for This Property
The Home Valuation Report is an in-depth analysis detailing your home's value as well as a comparison with similar homes in the area
Home Values in the Area
Average Home Value in this Area
Purchase History
| Date | Buyer | Sale Price | Title Company |
|---|---|---|---|
| Simmons Jacob J | -- | Amerititle | |
| Cromwell Jake Joseph | -- | None Available | |
| Gvc Family Llc | -- | None Available | |
| Nelson Steven Craig | -- | -- | |
| Miller Jerry R | -- | None Available |
Source: Public Records
Mortgage History
| Date | Status | Borrower | Loan Amount |
|---|---|---|---|
| Previous Owner | Cromwell Jake Joseph | $79,000 |
Source: Public Records
Tax History Compared to Growth
Tax History
| Year | Tax Paid | Tax Assessment Tax Assessment Total Assessment is a certain percentage of the fair market value that is determined by local assessors to be the total taxable value of land and additions on the property. | Land | Improvement |
|---|---|---|---|---|
| 2025 | $911 | $201,691 | $2,445 | $199,246 |
| 2024 | $911 | $214,355 | $19,050 | $195,305 |
| 2023 | $735 | $175,736 | $21,495 | $154,241 |
| 2022 | $1,036 | $160,674 | $17,398 | $143,276 |
| 2021 | $828 | $111,408 | $17,398 | $94,010 |
| 2019 | $898 | $102,482 | $14,787 | $87,695 |
| 2018 | $851 | $97,447 | $12,955 | $84,492 |
| 2017 | $808 | $87,664 | $10,704 | $76,960 |
| 2016 | $705 | $83,942 | $9,827 | $74,115 |
| 2015 | $699 | $71,763 | $9,827 | $61,936 |
| 2014 | $18,500 | $71,763 | $9,869 | $61,894 |
| 2013 | $662 | $69,958 | $7,056 | $62,902 |
Source: Public Records
Map
Nearby Homes
- TBA Royal Ave
- 798 Garfield St
- 921 E Elva St
- 400 College St
- 772 Cleveland St
- TBD Cleveland St
- 375 N Freeman Ave
- 220 N Fanning Ave Unit 9
- 220 N Fanning Ave Unit 15
- 1116 Lovejoy St
- 447 Cleveland St
- 1108 Halsey St
- 461 Gladstone St
- 287 Balsam Cir
- 485 N Higbee Ave
- 110 Chatham Dr
- 242 Pinon Dr
- 428 Lomax St
- 1210 Garfield St
- 339 Gladstone St
- 720 E Elva St Unit 9
- 720 E Elva St Unit 7
- 720 E Elva St Unit 6
- 720 E Elva St Unit 5
- 720 E Elva St
- 737 E Elva St
- 710 E Elva St Unit 4
- 710 E Elva St Unit 3
- 710 E Elva St Unit 2
- 710 E Elva St Unit 1
- 710 E Elva St
- 700 E Elva St Unit 4
- 700 E Elva St Unit 3
- 700 E Elva St Unit 2
- 700 E Elva St Unit 1
- 700 E Elva St
- 731 Whittier St
- 750 E Elva St
- 735 Whittier St
- 725 Whittier St