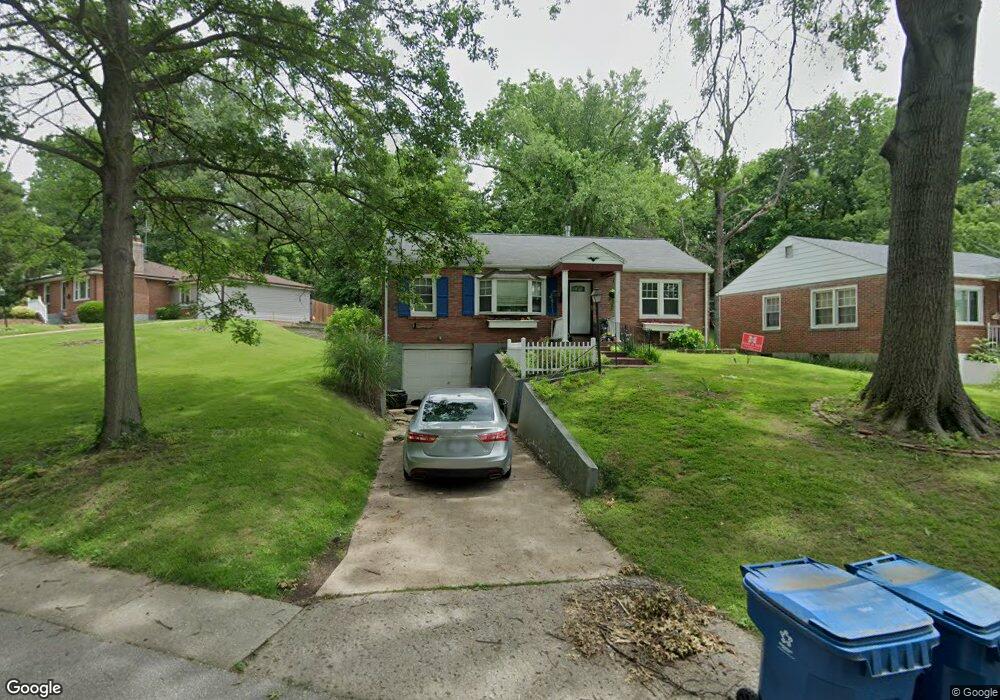
720 Gerald Place Saint Louis, MO 63135
Estimated Value: $143,136 - $183,000
3
Beds
2
Baths
1,351
Sq Ft
$122/Sq Ft
Est. Value
About This Home
This home is located at 720 Gerald Place, Saint Louis, MO 63135 and is currently estimated at $164,784, approximately $121 per square foot. 720 Gerald Place is a home located in St. Louis County with nearby schools including Lee Hamilton Elementary School, Ferguson Middle School, and McCluer High School.
Ownership History
Date
Name
Owned For
Owner Type
Purchase Details
Closed on
Jul 22, 2013
Sold by
Schramm Nicholas P and Schramm Melissa A
Bought by
Hill Wiley Barbara J and Wiley Jermaine
Current Estimated Value
Home Financials for this Owner
Home Financials are based on the most recent Mortgage that was taken out on this home.
Original Mortgage
$86,406
Outstanding Balance
$63,015
Interest Rate
3.99%
Mortgage Type
FHA
Estimated Equity
$101,769
Purchase Details
Closed on
Aug 27, 2004
Sold by
Larigan Mathew J
Bought by
Schramm Nicholas P and Cook Melissa A
Home Financials for this Owner
Home Financials are based on the most recent Mortgage that was taken out on this home.
Original Mortgage
$94,155
Interest Rate
5.82%
Mortgage Type
FHA
Purchase Details
Closed on
Aug 28, 1998
Sold by
Larigan Mathew J and Larigan Lauranne
Bought by
Larigan Lauranne B and Larigan Mathew J
Create a Home Valuation Report for This Property
The Home Valuation Report is an in-depth analysis detailing your home's value as well as a comparison with similar homes in the area
Home Values in the Area
Average Home Value in this Area
Purchase History
| Date | Buyer | Sale Price | Title Company |
|---|---|---|---|
| Hill Wiley Barbara J | $88,000 | Us Title Main | |
| Schramm Nicholas P | $94,900 | -- | |
| Larigan Lauranne B | -- | -- |
Source: Public Records
Mortgage History
| Date | Status | Borrower | Loan Amount |
|---|---|---|---|
| Open | Hill Wiley Barbara J | $86,406 | |
| Previous Owner | Schramm Nicholas P | $94,155 |
Source: Public Records
Tax History Compared to Growth
Tax History
| Year | Tax Paid | Tax Assessment Tax Assessment Total Assessment is a certain percentage of the fair market value that is determined by local assessors to be the total taxable value of land and additions on the property. | Land | Improvement |
|---|---|---|---|---|
| 2025 | $2,027 | $31,020 | $2,960 | $28,060 |
| 2024 | $2,027 | $28,040 | $2,660 | $25,380 |
| 2023 | $2,015 | $28,040 | $2,660 | $25,380 |
| 2022 | $1,707 | $20,650 | $3,400 | $17,250 |
| 2021 | $1,652 | $20,650 | $3,400 | $17,250 |
| 2020 | $1,566 | $17,580 | $2,740 | $14,840 |
| 2019 | $1,536 | $17,580 | $2,740 | $14,840 |
| 2018 | $1,439 | $14,670 | $2,380 | $12,290 |
| 2017 | $1,410 | $14,670 | $2,380 | $12,290 |
| 2016 | $1,542 | $15,810 | $2,380 | $13,430 |
| 2015 | $1,552 | $15,810 | $2,380 | $13,430 |
| 2014 | $1,298 | $13,030 | $2,010 | $11,020 |
Source: Public Records
Map
Nearby Homes
- 429 N Clay Ave
- 716 Nancy Place
- 405 Teston Dr
- 206 Thoroughman Ave
- 406 Teston Dr
- 6 Sandringham Ln
- 418 Millman Dr
- 941 N Elizabeth Ave
- 127 Thoroughman Ave
- 601 Chanslor Ave
- 111 Royal Ave
- 610 Superior Dr
- 539 Coppinger Dr
- 324 Ames Place
- 310 Ames Place
- 315 Coppinger Dr
- 818 Robert Ave
- 408 Coppinger Dr
- 847 N Florissant Rd
- 1226 Beaver Trail Dr
- 716 Gerald Place
- 802 Gerald Place
- 712 Gerald Place
- 721 Gerald Place
- 814 Gerald Place
- 801 Gerald Place
- 411 Robert Ave
- 805 Gerald Place
- 415 Robert Ave
- 717 Gerald Place
- 405 Robert Ave
- 809 Gerald Place
- 713 Gerald Place
- 401 Robert Ave
- 423 Robert Ave
- 5 Junior Ct
- 813 Gerald Place
- 818 Gerald Place
- 707 Gerald Place