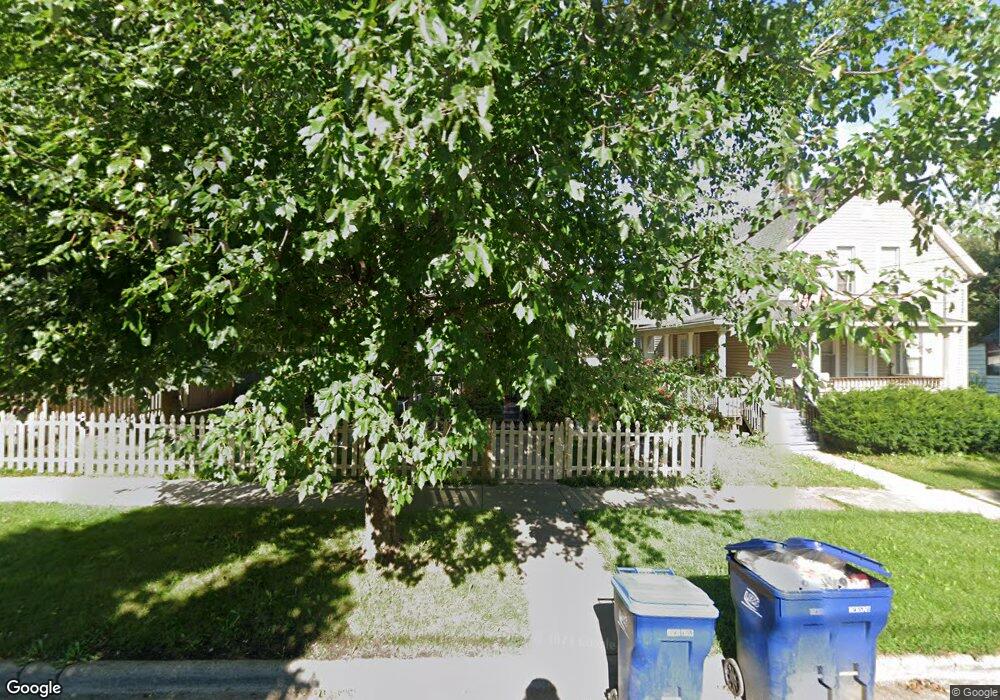
720 Hickory St Waukegan, IL 60085
Estimated Value: $228,239 - $253,000
3
Beds
1
Bath
1,621
Sq Ft
$149/Sq Ft
Est. Value
About This Home
This home is located at 720 Hickory St, Waukegan, IL 60085 and is currently estimated at $241,060, approximately $148 per square foot. 720 Hickory St is a home located in Lake County with nearby schools including Edith M Smith Middle School, Waukegan High School, and LEARN John & Kathy Schreiber Campus.
Ownership History
Date
Name
Owned For
Owner Type
Purchase Details
Closed on
Apr 26, 2006
Sold by
Lopez Luis and Avila Gloria
Bought by
Medina Jose
Current Estimated Value
Home Financials for this Owner
Home Financials are based on the most recent Mortgage that was taken out on this home.
Original Mortgage
$135,120
Outstanding Balance
$82,859
Interest Rate
7.45%
Mortgage Type
New Conventional
Estimated Equity
$158,201
Purchase Details
Closed on
Nov 7, 2003
Sold by
Rojas Catalina and Acosta Alvaro
Bought by
Lopez Luis and Avila Gloria
Home Financials for this Owner
Home Financials are based on the most recent Mortgage that was taken out on this home.
Original Mortgage
$140,022
Interest Rate
5.91%
Mortgage Type
FHA
Purchase Details
Closed on
Jun 28, 1999
Sold by
Moran Pamela D
Bought by
Acosta Alvaro and Rojas Catalina
Home Financials for this Owner
Home Financials are based on the most recent Mortgage that was taken out on this home.
Original Mortgage
$106,176
Interest Rate
7.69%
Mortgage Type
FHA
Purchase Details
Closed on
Aug 24, 1994
Sold by
Moran John W
Bought by
Moran Pamela D
Create a Home Valuation Report for This Property
The Home Valuation Report is an in-depth analysis detailing your home's value as well as a comparison with similar homes in the area
Home Values in the Area
Average Home Value in this Area
Purchase History
| Date | Buyer | Sale Price | Title Company |
|---|---|---|---|
| Medina Jose | $169,000 | First American Title Ins Co | |
| Lopez Luis | $142,000 | Ticor Title Insurance Compan | |
| Acosta Alvaro | $106,666 | -- | |
| Moran Pamela D | -- | -- |
Source: Public Records
Mortgage History
| Date | Status | Borrower | Loan Amount |
|---|---|---|---|
| Open | Medina Jose | $135,120 | |
| Previous Owner | Lopez Luis | $140,022 | |
| Previous Owner | Acosta Alvaro | $106,176 | |
| Closed | Acosta Alvaro | $3,000 |
Source: Public Records
Tax History Compared to Growth
Tax History
| Year | Tax Paid | Tax Assessment Tax Assessment Total Assessment is a certain percentage of the fair market value that is determined by local assessors to be the total taxable value of land and additions on the property. | Land | Improvement |
|---|---|---|---|---|
| 2024 | $4,443 | $61,184 | $8,758 | $52,426 |
| 2023 | $4,283 | $55,122 | $7,841 | $47,281 |
| 2022 | $4,283 | $49,808 | $7,457 | $42,351 |
| 2021 | $3,856 | $42,981 | $6,651 | $36,330 |
| 2020 | $3,859 | $40,042 | $6,196 | $33,846 |
| 2019 | $3,831 | $36,692 | $5,678 | $31,014 |
| 2018 | $3,638 | $34,521 | $7,234 | $27,287 |
| 2017 | $3,491 | $30,541 | $6,400 | $24,141 |
| 2016 | $3,174 | $26,539 | $5,561 | $20,978 |
| 2015 | $2,999 | $23,753 | $4,977 | $18,776 |
| 2014 | $2,671 | $21,325 | $3,604 | $17,721 |
| 2012 | $3,530 | $23,103 | $3,904 | $19,199 |
Source: Public Records
Map
Nearby Homes
- 620 N Poplar St
- 702 Franklin St
- 522 N Poplar St
- 428 N Poplar St
- 511 Chestnut St
- 452 North Ave
- 325 4th St
- 918 N Ash St
- 723 N County St
- 415 W Ridgeland Ave
- 611 N Genesee St
- 917 N Linden Ave
- 1110 N Ash St
- 1122 N Ash St
- 222 Grand Ave
- 217 Stewart Ave
- 509 N Butrick St
- 1000 Pine St
- 824 N Butrick St
- 1105 Woodlawn Cir