720 High Bluff Cir Metter, GA 30439
Estimated Value: $279,246 - $389,000
3
Beds
2
Baths
1,592
Sq Ft
$215/Sq Ft
Est. Value
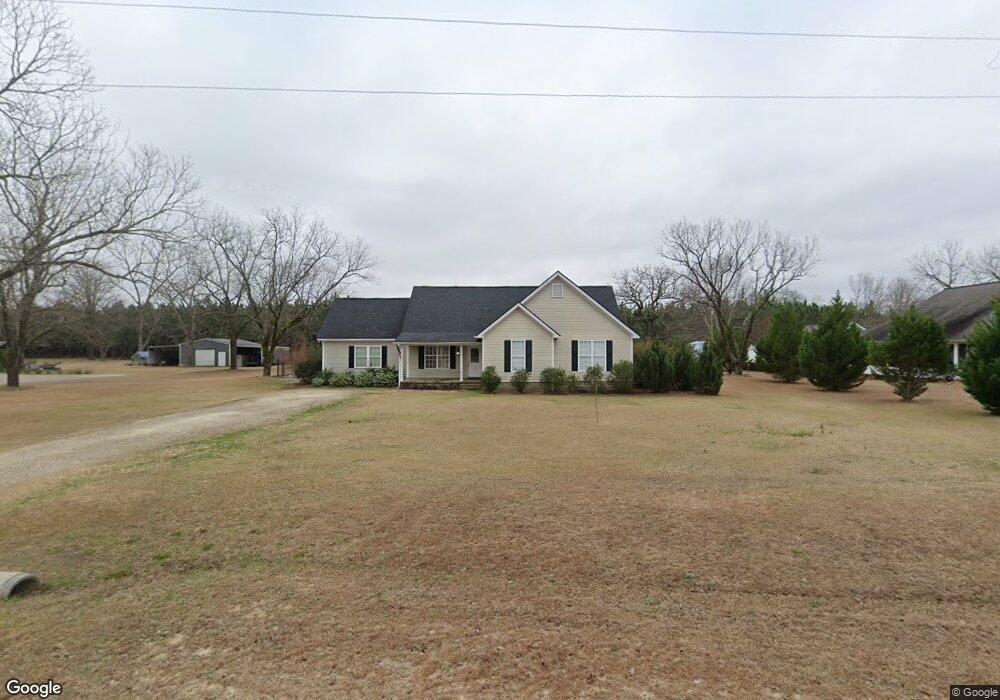
About This Home
This home is located at 720 High Bluff Cir, Metter, GA 30439 and is currently estimated at $341,562, approximately $214 per square foot. 720 High Bluff Cir is a home located in Candler County with nearby schools including Metter Elementary School, Metter Intermediate School, and Metter Middle School.
Ownership History
Date
Name
Owned For
Owner Type
Purchase Details
Closed on
Sep 15, 2016
Sold by
Powell Edward H
Bought by
Powell Rayburn H
Current Estimated Value
Home Financials for this Owner
Home Financials are based on the most recent Mortgage that was taken out on this home.
Original Mortgage
$134,000
Outstanding Balance
$107,034
Interest Rate
3.43%
Mortgage Type
New Conventional
Estimated Equity
$234,528
Purchase Details
Closed on
May 26, 2016
Sold by
Garcia Mark Steven
Bought by
Powell Edward H
Purchase Details
Closed on
Sep 20, 2006
Sold by
Morrow Michael
Bought by
Garcia Mark Steven
Purchase Details
Closed on
Aug 26, 2002
Sold by
Morrow Michael and Garcia Mark Stephen
Bought by
Morrow Michael and Mark Steven Garci
Purchase Details
Closed on
Jul 23, 2002
Sold by
Holloway Lance
Bought by
Morrow Michael and Garcia Mark Step
Purchase Details
Closed on
Oct 22, 1998
Sold by
Brown Childs Realty
Bought by
Holloway Lance
Create a Home Valuation Report for This Property
The Home Valuation Report is an in-depth analysis detailing your home's value as well as a comparison with similar homes in the area
Home Values in the Area
Average Home Value in this Area
Purchase History
| Date | Buyer | Sale Price | Title Company |
|---|---|---|---|
| Powell Rayburn H | $149,000 | -- | |
| Powell Edward H | $100,000 | -- | |
| Garcia Mark Steven | -- | -- | |
| Morrow Michael | -- | -- | |
| Morrow Michael | $6,900 | -- | |
| Holloway Lance | $40,100 | -- |
Source: Public Records
Mortgage History
| Date | Status | Borrower | Loan Amount |
|---|---|---|---|
| Open | Powell Rayburn H | $134,000 |
Source: Public Records
Tax History Compared to Growth
Tax History
| Year | Tax Paid | Tax Assessment Tax Assessment Total Assessment is a certain percentage of the fair market value that is determined by local assessors to be the total taxable value of land and additions on the property. | Land | Improvement |
|---|---|---|---|---|
| 2024 | $3,096 | $95,053 | $4,905 | $90,148 |
| 2023 | $2,342 | $90,938 | $4,905 | $86,033 |
| 2022 | $2,391 | $75,399 | $4,905 | $70,494 |
| 2021 | $2,089 | $65,937 | $4,905 | $61,032 |
| 2020 | $1,908 | $59,113 | $4,905 | $54,208 |
| 2019 | $1,913 | $59,113 | $4,905 | $54,208 |
| 2018 | $1,199 | $43,056 | $2,952 | $40,104 |
| 2017 | $1,110 | $42,444 | $2,340 | $40,104 |
| 2016 | $1,499 | $42,444 | $2,340 | $40,104 |
| 2015 | $1,302 | $43,374 | $2,340 | $41,034 |
| 2014 | $1,302 | $43,374 | $2,340 | $41,034 |
Source: Public Records
Map
Nearby Homes
- 527 Windmill Rd
- 14450 Stillmore Hwy
- 743 Ann's Ln
- 26844 Georgia 46
- 4515 Harper Rd
- 1449 Hulsey Dr
- 0 Central Ave Unit 10628403
- 615 Railroad Ave
- 465 Cedar St
- 286 Webb Cir
- 150 W Willow Lake Dr
- 760 Memphis Rd
- 40 Hickory St
- 405 Preston St
- 250 S Lewis St
- 450 S Rountree St
- 295 S Lewis St
- 550 S Rountree St
- 365 S Leroy St
- 405 S Leroy St
- 902 High Bluff Cir
- 902 W High Bluff C Ir
- 580 High Bluff Cir
- W High Bluff Cir
- 1044 High Bluff Cir
- 589 High Bluff Cir
- 993 High Bluff Cir
- 1230 High Bluff Cir
- 1193 High Bluff Cir
- 984 Windmill Rd
- 598 Windmill Rd
- 00 Canoe Lake Rd
- 730 Windmill Rd
- 1598 Windmill Rd
- 1262 Windmill Rd
- 1724 Windmill Rd Unit 24
- 1724 Windmill Rd
- 1844 Windmill Rd
- 23305 Hiawatha Rd
- 1308 High Bluff Cir