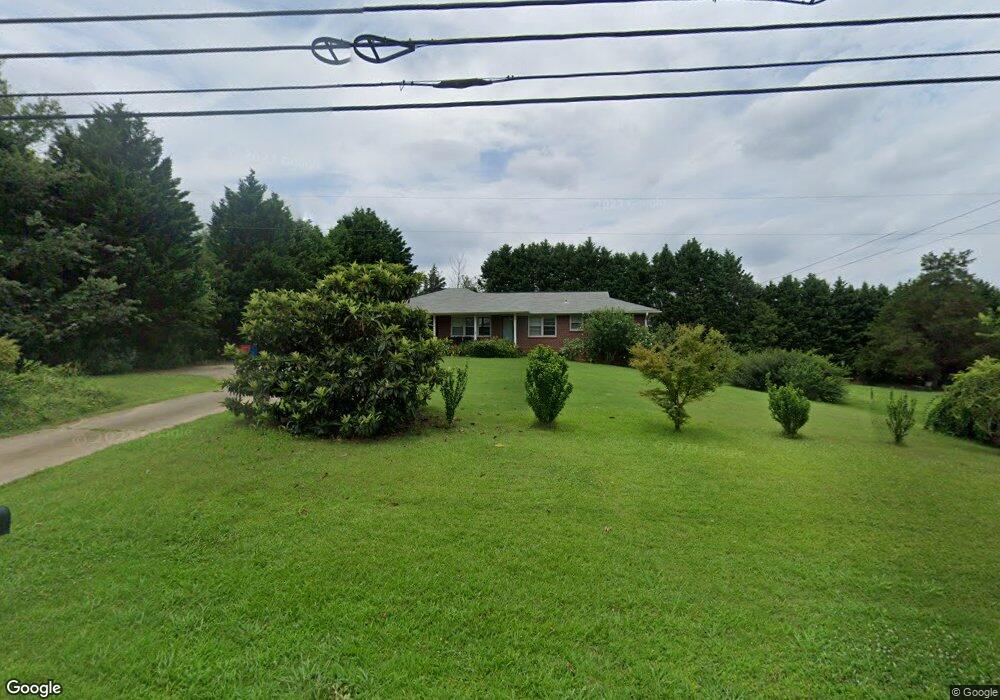
720 Jefferson Hwy Winder, GA 30680
Estimated Value: $332,739 - $372,000
4
Beds
2
Baths
2,520
Sq Ft
$138/Sq Ft
Est. Value
About This Home
This home is located at 720 Jefferson Hwy, Winder, GA 30680 and is currently estimated at $348,435, approximately $138 per square foot. 720 Jefferson Hwy is a home located in Barrow County with nearby schools including Holsenbeck Elementary School, Bear Creek Middle School, and Winder-Barrow High School.
Ownership History
Date
Name
Owned For
Owner Type
Purchase Details
Closed on
Sep 10, 2021
Sold by
Her Sy Xiafong
Bought by
Her Mee Yang
Current Estimated Value
Purchase Details
Closed on
May 27, 2011
Sold by
Wamu Series 2007-He3 Trust
Bought by
Her Sy X and Her Mee Y
Purchase Details
Closed on
Jan 4, 2011
Sold by
Vrooman Joseph B
Bought by
Wamu Series 2007-He3 Trust
Purchase Details
Closed on
Mar 31, 2000
Sold by
Fullerton Brian H
Bought by
Vrooman Joseph B
Home Financials for this Owner
Home Financials are based on the most recent Mortgage that was taken out on this home.
Original Mortgage
$97,615
Interest Rate
8.38%
Mortgage Type
New Conventional
Purchase Details
Closed on
Feb 28, 1997
Sold by
Union Baptist Church Ministries
Bought by
Fullerton Brian and Vanvolkenburg Dianne
Purchase Details
Closed on
Jan 30, 1995
Sold by
Union Baptist
Bought by
Union Baptist Church
Create a Home Valuation Report for This Property
The Home Valuation Report is an in-depth analysis detailing your home's value as well as a comparison with similar homes in the area
Home Values in the Area
Average Home Value in this Area
Purchase History
| Date | Buyer | Sale Price | Title Company |
|---|---|---|---|
| Her Mee Yang | -- | -- | |
| Her Sy X | $42,000 | -- | |
| Wamu Series 2007-He3 Trust | $57,382 | -- | |
| Citibank Na As Trustee For Wamu Series | $57,400 | -- | |
| Vrooman Joseph B | $98,500 | -- | |
| Fullerton Brian | $81,900 | -- | |
| Union Baptist Church | -- | -- |
Source: Public Records
Mortgage History
| Date | Status | Borrower | Loan Amount |
|---|---|---|---|
| Previous Owner | Vrooman Joseph B | $97,615 | |
| Closed | Fullerton Brian | $0 |
Source: Public Records
Tax History Compared to Growth
Tax History
| Year | Tax Paid | Tax Assessment Tax Assessment Total Assessment is a certain percentage of the fair market value that is determined by local assessors to be the total taxable value of land and additions on the property. | Land | Improvement |
|---|---|---|---|---|
| 2024 | $1,098 | $99,202 | $18,000 | $81,202 |
| 2023 | $690 | $99,202 | $18,000 | $81,202 |
| 2022 | $455 | $53,942 | $10,000 | $43,942 |
| 2021 | $483 | $53,942 | $10,000 | $43,942 |
| 2020 | $474 | $53,942 | $10,000 | $43,942 |
| 2019 | $427 | $48,096 | $10,000 | $38,096 |
| 2018 | $1,368 | $48,096 | $10,000 | $38,096 |
| 2017 | $1,225 | $42,080 | $10,000 | $32,080 |
| 2016 | $1,156 | $42,080 | $10,000 | $32,080 |
| 2015 | $1,161 | $42,080 | $10,000 | $32,080 |
| 2014 | $1,013 | $36,980 | $4,900 | $32,080 |
| 2013 | -- | $34,762 | $4,900 | $29,862 |
Source: Public Records
Map
Nearby Homes
- 724 Jefferson Hwy
- 881 Stratford Way
- 883 Stratford Way Unit 29
- 641 Carla Ct
- 552 Stratford Pkwy
- 643 Carla Ct
- 642 Carla Ct
- 554 Stratford Pkwy
- 734 Jefferson Hwy
- 557 Stratford Pkwy
- 557 Stratford Pkwy Unit 1
- 707 Jefferson Hwy
- 882 Stratford Way
- 884 Stratford Way
- 884 Stratford Way Unit 28
- 645 Carla Ct
- 556 Stratford Pkwy
- 644 Carla Ct
- 558 Stratford Pkwy
- 743 Jefferson Hwy