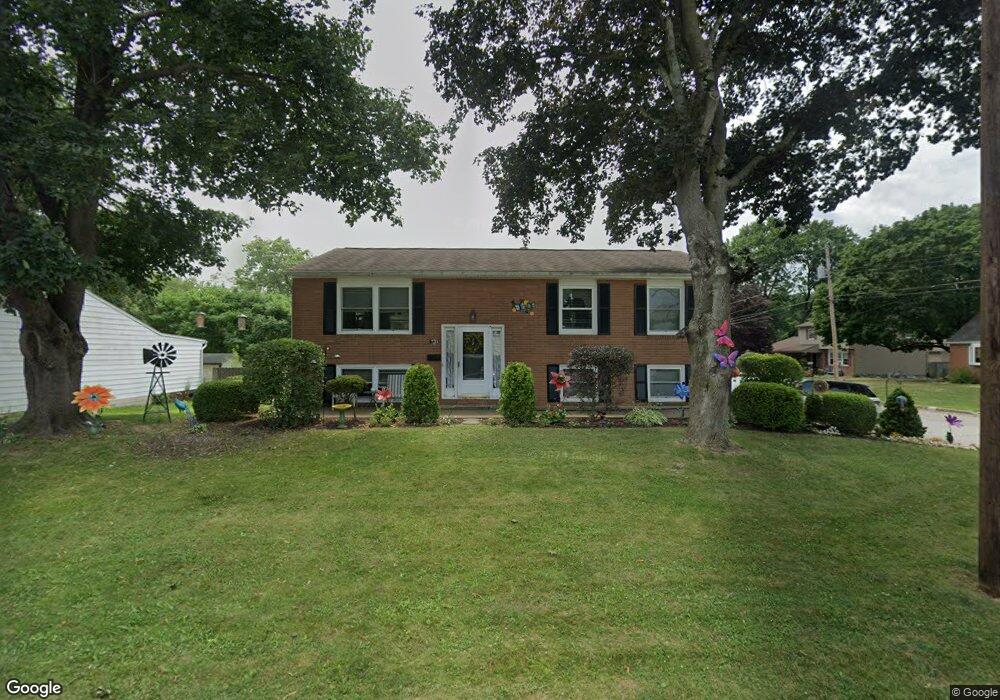
720 Lynbrook St SE North Canton, OH 44720
Mount Vernon NeighborhoodEstimated Value: $225,095 - $282,000
3
Beds
2
Baths
1,827
Sq Ft
$136/Sq Ft
Est. Value
About This Home
This home is located at 720 Lynbrook St SE, North Canton, OH 44720 and is currently estimated at $247,774, approximately $135 per square foot. 720 Lynbrook St SE is a home located in Stark County with nearby schools including North Canton Middle School, Hoover High School, and St Paul School.
Ownership History
Date
Name
Owned For
Owner Type
Purchase Details
Closed on
Dec 29, 2021
Sold by
Davis Melanie S
Bought by
Tax Ease Oh Iv Llc
Current Estimated Value
Purchase Details
Closed on
May 10, 2013
Sold by
George Angeline W
Bought by
Davis Melanie S
Purchase Details
Closed on
May 15, 2009
Sold by
Machamer John R and Machamer Stephanie
Bought by
George Angeline W and Angeline W George Trust
Purchase Details
Closed on
Nov 10, 1988
Create a Home Valuation Report for This Property
The Home Valuation Report is an in-depth analysis detailing your home's value as well as a comparison with similar homes in the area
Home Values in the Area
Average Home Value in this Area
Purchase History
| Date | Buyer | Sale Price | Title Company |
|---|---|---|---|
| Tax Ease Oh Iv Llc | $2,845 | None Listed On Document | |
| Davis Melanie S | -- | None Available | |
| George Angeline W | $126,000 | Attorney | |
| -- | $64,500 | -- |
Source: Public Records
Tax History Compared to Growth
Tax History
| Year | Tax Paid | Tax Assessment Tax Assessment Total Assessment is a certain percentage of the fair market value that is determined by local assessors to be the total taxable value of land and additions on the property. | Land | Improvement |
|---|---|---|---|---|
| 2025 | $1,543 | $67,940 | $14,910 | $53,030 |
| 2024 | $1,475 | $67,940 | $14,910 | $53,030 |
| 2023 | $4,262 | $48,830 | $11,060 | $37,770 |
| 2022 | $2,511 | $48,830 | $11,060 | $37,770 |
| 2021 | $2,422 | $48,830 | $11,060 | $37,770 |
| 2020 | $2,334 | $42,250 | $9,630 | $32,620 |
| 2019 | $2,178 | $42,250 | $9,630 | $32,620 |
| 2018 | $2,258 | $42,250 | $9,630 | $32,620 |
| 2017 | $2,003 | $39,340 | $8,610 | $30,730 |
| 2016 | $6,776 | $39,340 | $8,610 | $30,730 |
| 2015 | $2,118 | $39,340 | $8,610 | $30,730 |
| 2014 | $7 | $36,540 | $7,980 | $28,560 |
| 2013 | $1,036 | $36,540 | $7,980 | $28,560 |
Source: Public Records
Map
Nearby Homes
- 1321 Clinton Ave SE
- 1126 Overridge Ave SE
- 1118 Overridge Ave SE
- 505 Rose Lane St SE
- 1381 Circle Hill Rd SE
- 322 Schneider St SE
- 139 Maplecrest St SW
- 161 Hallum St SW
- 634 Edgewood St SE
- 714 Pershing Ave SE
- 218 Bonnett St SW
- 701 Edgewood St SE
- 1603 S Main St Unit B
- 1402 Schneider St NW
- 253 Glenwood St SW
- 1415 Red Coach St SE
- 404 Cordelia St SW
- 723 Jennifer Dr NW
- 1690 Carlton Ave SE
- 1224 Grassmere St SE
- 728 Lynbrook St SE
- 1320 Clearmount Ave SE
- 734 Lynbrook St SE
- 1335 Clearmount Ave SE
- 1329 Clearmount Ave SE
- 1347 Clearmount Ave SE
- 1323 Clearmount Ave SE
- 1314 Clearmount Ave SE
- 740 Lynbrook St SE
- 1317 Clearmount Ave SE
- 1315 Clinton Ave SE
- 1308 Clearmount Ave SE
- 802 Lynbrook St SE
- 1313 Clearmount Ave SE
- 1311 Clinton Ave SE
- 1338 Willoway Ave SE
- 1344 Willoway Ave SE
- 1352 Willoway Ave SE
- 1332 Willoway Ave SE
- 1307 Clearmount Ave SE