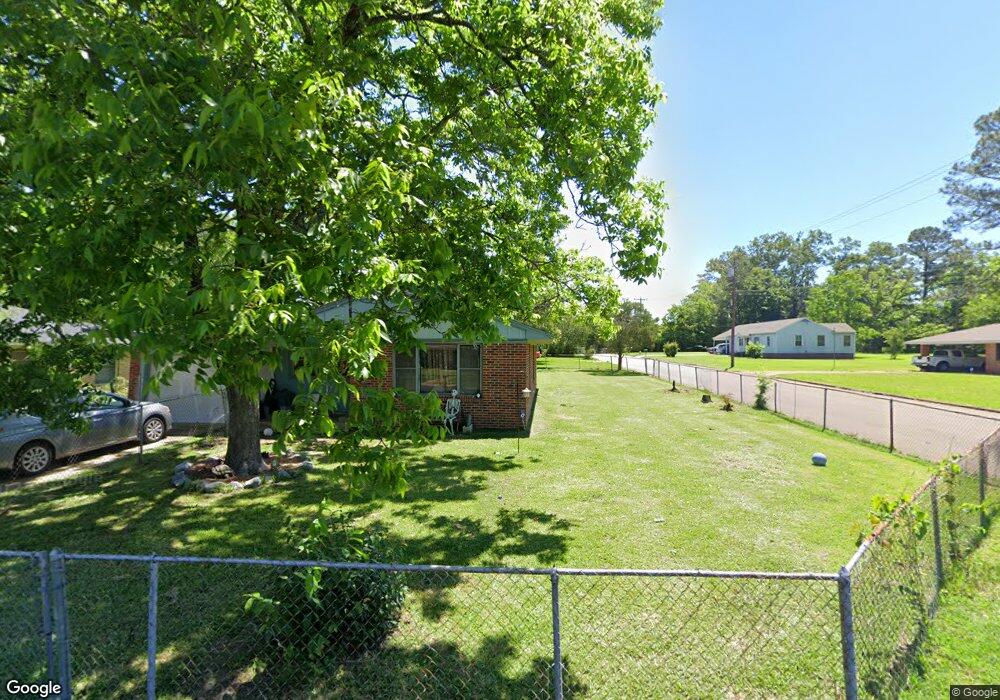
720 Mccord St West Point, MS 39773
Estimated Value: $95,000 - $131,068
2
Beds
--
Bath
1,457
Sq Ft
$80/Sq Ft
Est. Value
About This Home
This home is located at 720 Mccord St, West Point, MS 39773 and is currently estimated at $116,517, approximately $79 per square foot. 720 Mccord St is a home located in Clay County with nearby schools including East Side Elementary School, West Clay Elementary School, and Church Hill Elementary School.
Ownership History
Date
Name
Owned For
Owner Type
Purchase Details
Closed on
May 21, 2021
Sold by
Wilson Jackie L
Bought by
Smith Emily
Current Estimated Value
Home Financials for this Owner
Home Financials are based on the most recent Mortgage that was taken out on this home.
Original Mortgage
$54,436
Outstanding Balance
$48,745
Interest Rate
2.9%
Mortgage Type
Unknown
Estimated Equity
$67,772
Purchase Details
Closed on
Feb 29, 2008
Sold by
Shiflett Peggy
Bought by
Wilson William E and Wilson Jackie L
Create a Home Valuation Report for This Property
The Home Valuation Report is an in-depth analysis detailing your home's value as well as a comparison with similar homes in the area
Purchase History
| Date | Buyer | Sale Price | Title Company |
|---|---|---|---|
| Smith Emily | -- | -- | |
| Wilson William E | -- | -- |
Source: Public Records
Mortgage History
| Date | Status | Borrower | Loan Amount |
|---|---|---|---|
| Open | Smith Emily | $54,436 |
Source: Public Records
Tax History
| Year | Tax Paid | Tax Assessment Tax Assessment Total Assessment is a certain percentage of the fair market value that is determined by local assessors to be the total taxable value of land and additions on the property. | Land | Improvement |
|---|---|---|---|---|
| 2025 | $241 | $7,041 | $778 | $6,263 |
| 2024 | $241 | $7,041 | $778 | $6,263 |
| 2023 | $639 | $5,876 | $778 | $5,098 |
| 2022 | $200 | $5,876 | $778 | $5,098 |
| 2021 | $479 | $8,812 | $1,166 | $7,646 |
| 2020 | $479 | $8,812 | $1,166 | $7,646 |
| 2019 | $448 | $8,675 | $1,166 | $7,509 |
| 2018 | $430 | $8,675 | $1,166 | $7,509 |
| 2017 | $430 | $8,675 | $1,166 | $7,509 |
| 2016 | $413 | $8,675 | $1,166 | $7,509 |
| 2015 | $390 | $7,915 | $1,166 | $6,749 |
| 2014 | -- | $7,915 | $1,166 | $6,749 |
| 2013 | -- | $7,915 | $1,166 | $6,749 |
Source: Public Records
Map
Nearby Homes
- 1414 E Brame Ave
- 1046 E Brame Ave
- 405 S Eshman Ave
- 44 Torbert Dr
- 472 S Eshman Ave
- 507 S Eshman Ave
- 15 David St
- 228 Mccord St
- 229 Clark Cir
- 105 Converse Dr
- 278 Converse Dr
- 341 Mccord St
- 329 Converse Dr
- 112 Meadow Hill Rd
- 913 E Westbrook St
- 600 E Westbrook St
- 98 Calhoun St
- 65 Calhoun St
- 551 E Westbrook St
- 238 Calhoun St
- 716 Mccord St
- 1119 E Brame Ave
- 1116 E Brame Ave
- 1100 E Brame Ave
- 1382 E Brame Ave
- 1382 E Brame
- 723 Mccord St
- 712 Mccord St
- 1126 E Brame Ave
- 704 Mccord St
- 1117 Hibbler St
- 1116 Hibbler St
- 1353 E Brame Ave
- 711 Mccord St
- 1066 Hibbler St
- 383 S Eshman Ave
- 1054 Hibbler St
- 810 Clark Cir
- 1039 E Brame Ave
- 804 Clark Cir
Your Personal Tour Guide
Ask me questions while you tour the home.