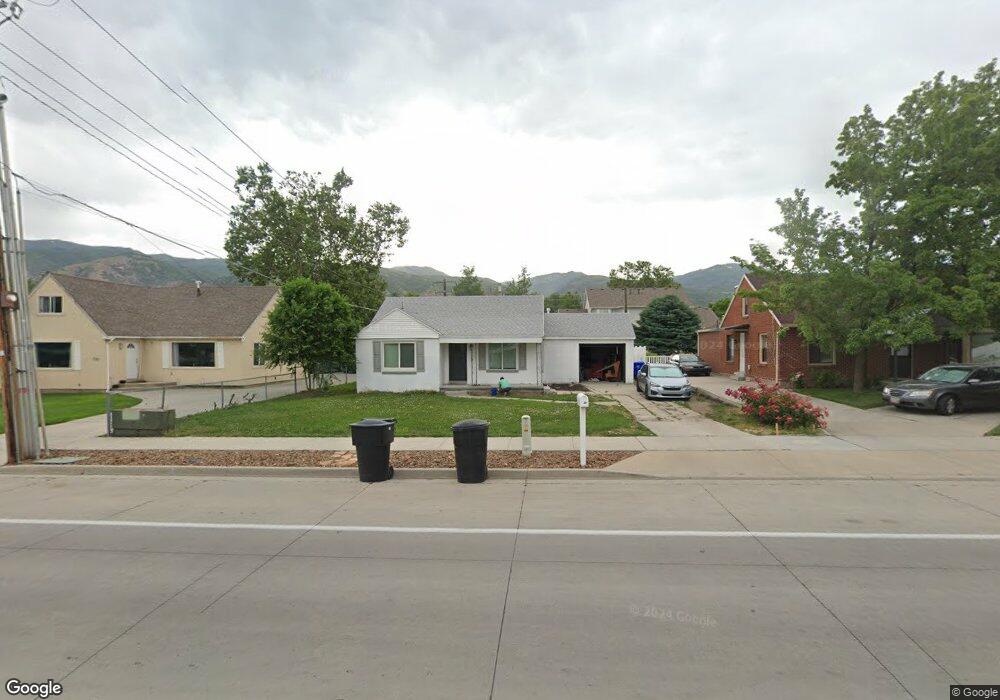
720 N 200 W Bountiful, UT 84010
Estimated Value: $403,000 - $483,000
3
Beds
1
Bath
1,262
Sq Ft
$351/Sq Ft
Est. Value
About This Home
This home is located at 720 N 200 W, Bountiful, UT 84010 and is currently estimated at $443,123, approximately $351 per square foot. 720 N 200 W is a home located in Davis County with nearby schools including Meadowbrook Elementary School, Bountiful Junior High School, and Viewmont High School.
Ownership History
Date
Name
Owned For
Owner Type
Purchase Details
Closed on
Nov 18, 2021
Sold by
Breckenridge Property Fund 2016 Llc
Bought by
Chipman Michael
Current Estimated Value
Home Financials for this Owner
Home Financials are based on the most recent Mortgage that was taken out on this home.
Original Mortgage
$320,000
Outstanding Balance
$293,225
Interest Rate
2.99%
Mortgage Type
New Conventional
Estimated Equity
$149,898
Purchase Details
Closed on
May 28, 2021
Sold by
Robinson Kimberley and Estate Of Robet J Gannon
Bought by
Breckenridge Property Fund 2016 Llc
Purchase Details
Closed on
Apr 23, 1996
Sold by
Young M Gail
Bought by
Gannon Robert John
Create a Home Valuation Report for This Property
The Home Valuation Report is an in-depth analysis detailing your home's value as well as a comparison with similar homes in the area
Purchase History
| Date | Buyer | Sale Price | Title Company |
|---|---|---|---|
| Chipman Michael | -- | Inwest Title Services | |
| Breckenridge Property Fund 2016 Llc | -- | Vanguard Title Ins Un | |
| Gannon Robert John | -- | -- |
Source: Public Records
Mortgage History
| Date | Status | Borrower | Loan Amount |
|---|---|---|---|
| Open | Chipman Michael | $320,000 |
Source: Public Records
Tax History
| Year | Tax Paid | Tax Assessment Tax Assessment Total Assessment is a certain percentage of the fair market value that is determined by local assessors to be the total taxable value of land and additions on the property. | Land | Improvement |
|---|---|---|---|---|
| 2025 | $2,555 | $209,000 | $133,804 | $75,196 |
| 2024 | $2,186 | $201,300 | $120,006 | $81,294 |
| 2023 | $2,238 | $351,000 | $220,402 | $130,598 |
| 2022 | $2,424 | $199,100 | $120,249 | $78,851 |
| 2021 | $1,756 | $244,000 | $157,390 | $86,610 |
| 2020 | $1,551 | $215,000 | $134,191 | $80,809 |
| 2019 | $1,558 | $211,000 | $139,998 | $71,002 |
| 2018 | $1,419 | $188,000 | $137,192 | $50,808 |
| 2016 | $1,225 | $87,780 | $57,424 | $30,356 |
| 2015 | $1,268 | $85,305 | $57,424 | $27,881 |
| 2014 | $1,298 | $91,595 | $57,424 | $34,171 |
| 2013 | -- | $81,972 | $37,353 | $44,619 |
Source: Public Records
Map
Nearby Homes
- 106 W 700 N
- 184 Park Shadows Cir
- 93 W 700 N
- 563 N 200 W
- 499 N 200 W Unit 30
- 1130 N 200 W
- 320 N 200 W Unit 4
- 332 N 300 W
- 366 W 1000 N
- 1260 N 200 W
- 790 N 500 W
- 401 W 400 N Unit 49
- 399 W 400 N Unit 47
- 235 W 1400 N
- 252 N Main St
- 256 N Main St
- 254 N Main St
- 41 E 200 N Unit 6
- 49 E 200 N Unit 4
- 51 E 200 N Unit 3
- 710 N 200 W
- 730 N 200 W
- 725 Park Shadow Ln
- 725 Park Shadow Ln Unit 38
- 725 Park Shadows Cir
- 737 Park Shadows Cir
- 737 Park Shadow Ln Unit 37
- 719 Park Shadows Cir
- 719 Park Shadow Ln
- 700 N 200 W
- 740 N 200 W
- 749 Park Shadows Cir
- 749 Park Shadow Ln Unit 36
- 749 Park Shadow Ln
- 707 Park Shadow Ln
- 707 Park Shadows Cir
- 755 Park Shadows Cir
- 755 Park Shadow Ln
- 701 Park Shadow Ln
- 701 Park Shadows Cir
Your Personal Tour Guide
Ask me questions while you tour the home.