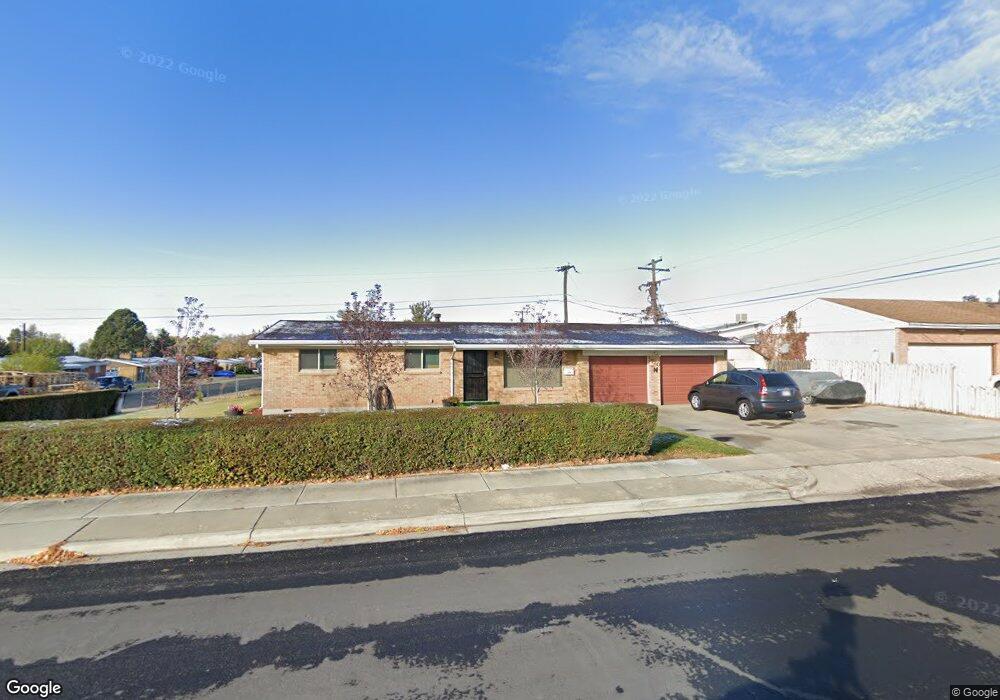
720 N 200 W Clearfield, UT 84015
Estimated Value: $383,000 - $398,828
3
Beds
2
Baths
1,716
Sq Ft
$228/Sq Ft
Est. Value
About This Home
This home is located at 720 N 200 W, Clearfield, UT 84015 and is currently estimated at $390,957, approximately $227 per square foot. 720 N 200 W is a home located in Davis County with nearby schools including Doxey Elementary School, North Davis Junior High School, and Clearfield High School.
Ownership History
Date
Name
Owned For
Owner Type
Purchase Details
Closed on
Dec 9, 2003
Sold by
Hardman Kendall N and Hardman Brenda B
Bought by
Sanchez Jesus A and Sanchez Dina E
Current Estimated Value
Home Financials for this Owner
Home Financials are based on the most recent Mortgage that was taken out on this home.
Original Mortgage
$102,520
Outstanding Balance
$47,264
Interest Rate
5.92%
Mortgage Type
Purchase Money Mortgage
Estimated Equity
$343,693
Purchase Details
Closed on
Sep 17, 1999
Sold by
Smith Paul J and Smith Denise S
Bought by
Hardman Kendall N and Hardman Brenda B
Home Financials for this Owner
Home Financials are based on the most recent Mortgage that was taken out on this home.
Original Mortgage
$82,000
Interest Rate
7.89%
Purchase Details
Closed on
Dec 15, 1998
Sold by
Smith Paul J
Bought by
Smith Paul J and Smith Denise S
Home Financials for this Owner
Home Financials are based on the most recent Mortgage that was taken out on this home.
Original Mortgage
$89,000
Interest Rate
6.86%
Create a Home Valuation Report for This Property
The Home Valuation Report is an in-depth analysis detailing your home's value as well as a comparison with similar homes in the area
Home Values in the Area
Average Home Value in this Area
Purchase History
| Date | Buyer | Sale Price | Title Company |
|---|---|---|---|
| Sanchez Jesus A | -- | First American Title Co | |
| Hardman Kendall N | -- | Avis & Archibald Title Insur | |
| Smith Paul J | -- | Associated Title |
Source: Public Records
Mortgage History
| Date | Status | Borrower | Loan Amount |
|---|---|---|---|
| Open | Sanchez Jesus A | $102,520 | |
| Previous Owner | Hardman Kendall N | $82,000 | |
| Previous Owner | Smith Paul J | $89,000 |
Source: Public Records
Tax History
| Year | Tax Paid | Tax Assessment Tax Assessment Total Assessment is a certain percentage of the fair market value that is determined by local assessors to be the total taxable value of land and additions on the property. | Land | Improvement |
|---|---|---|---|---|
| 2025 | $2,240 | $200,750 | $71,854 | $128,896 |
| 2024 | $2,181 | $196,900 | $68,269 | $128,631 |
| 2023 | $2,028 | $336,000 | $108,973 | $227,027 |
| 2022 | $2,025 | $181,500 | $62,243 | $119,257 |
| 2021 | $1,832 | $248,000 | $67,462 | $180,538 |
| 2020 | $1,592 | $214,000 | $56,995 | $157,005 |
| 2019 | $1,560 | $207,000 | $58,775 | $148,225 |
| 2018 | $1,400 | $181,000 | $49,137 | $131,863 |
| 2016 | $1,224 | $82,720 | $20,766 | $61,954 |
| 2015 | $1,169 | $75,350 | $20,766 | $54,584 |
| 2014 | $1,169 | $76,385 | $20,766 | $55,619 |
| 2013 | -- | $72,719 | $23,378 | $49,341 |
Source: Public Records
Map
Nearby Homes
Your Personal Tour Guide
Ask me questions while you tour the home.