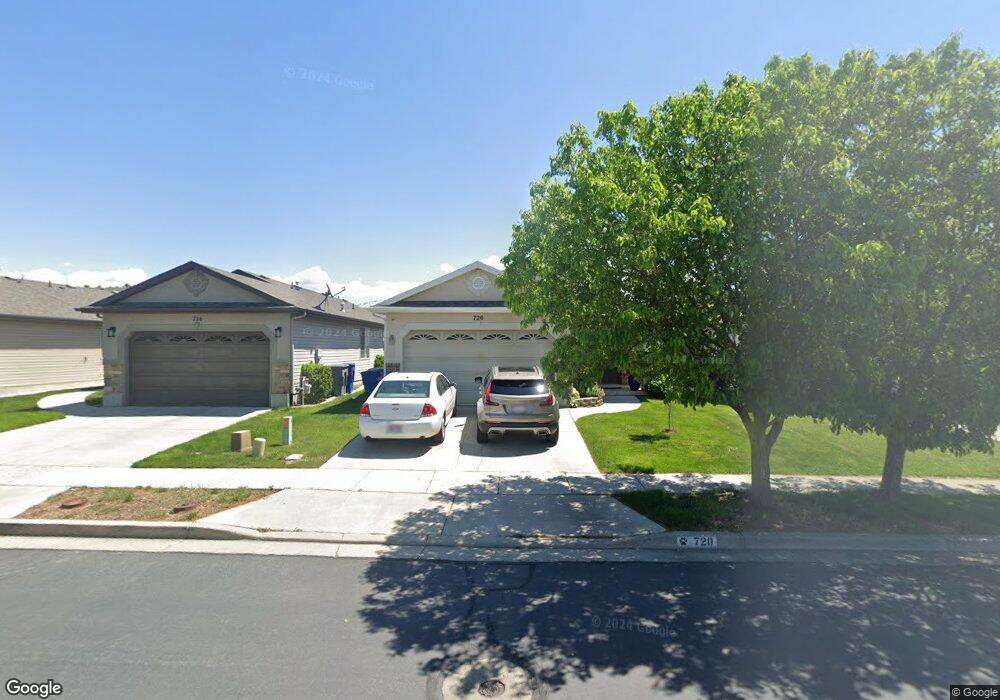
720 N Skipton Dr North Salt Lake, UT 84054
Estimated Value: $449,000 - $470,000
3
Beds
2
Baths
1,282
Sq Ft
$360/Sq Ft
Est. Value
About This Home
This home is located at 720 N Skipton Dr, North Salt Lake, UT 84054 and is currently estimated at $461,858, approximately $360 per square foot. 720 N Skipton Dr is a home located in Davis County with nearby schools including Foxboro School, Mueller Park Junior High School, and Bountiful High School.
Ownership History
Date
Name
Owned For
Owner Type
Purchase Details
Closed on
May 20, 2016
Sold by
Cornick Jeffrey M and Cornick Kailey M
Bought by
Jones Daniel T and Jones Judy
Current Estimated Value
Purchase Details
Closed on
Nov 2, 2006
Sold by
Foxboro Village Llc
Bought by
Cornick Jeffrey M and Cornick Kailey M
Home Financials for this Owner
Home Financials are based on the most recent Mortgage that was taken out on this home.
Original Mortgage
$195,320
Interest Rate
7.37%
Mortgage Type
Purchase Money Mortgage
Purchase Details
Closed on
May 19, 2006
Sold by
Portola Development Utah Lc
Bought by
Foxboro Villages Llc
Purchase Details
Closed on
Jun 28, 2005
Sold by
Portola Development Utah Lc
Bought by
South Davis Sewer District
Create a Home Valuation Report for This Property
The Home Valuation Report is an in-depth analysis detailing your home's value as well as a comparison with similar homes in the area
Home Values in the Area
Average Home Value in this Area
Purchase History
| Date | Buyer | Sale Price | Title Company |
|---|---|---|---|
| Jones Daniel T | -- | Security Title | |
| Cornick Jeffrey M | -- | Us Title Company Of Utah | |
| Foxboro Villages Llc | -- | Accommodation | |
| South Davis Sewer District | -- | -- |
Source: Public Records
Mortgage History
| Date | Status | Borrower | Loan Amount |
|---|---|---|---|
| Previous Owner | Cornick Jeffrey M | $195,320 |
Source: Public Records
Tax History Compared to Growth
Tax History
| Year | Tax Paid | Tax Assessment Tax Assessment Total Assessment is a certain percentage of the fair market value that is determined by local assessors to be the total taxable value of land and additions on the property. | Land | Improvement |
|---|---|---|---|---|
| 2025 | $2,351 | $238,700 | $89,934 | $148,766 |
| 2024 | $2,351 | $236,500 | $92,025 | $144,475 |
| 2023 | $2,200 | $400,000 | $118,675 | $281,325 |
| 2022 | $2,404 | $228,250 | $51,771 | $176,479 |
| 2021 | $2,060 | $312,000 | $72,709 | $239,291 |
| 2020 | $1,822 | $273,000 | $62,127 | $210,873 |
| 2019 | $1,939 | $271,000 | $55,543 | $215,457 |
| 2018 | $1,681 | $243,000 | $50,494 | $192,506 |
| 2016 | $1,417 | $108,955 | $27,772 | $81,183 |
| 2015 | $1,418 | $104,720 | $27,772 | $76,948 |
| 2014 | $1,509 | $113,590 | $27,772 | $85,818 |
| 2013 | -- | $94,324 | $29,712 | $64,612 |
Source: Public Records
Map
Nearby Homes
- 741 N Skipton Dr
- 715 Leeds Ct
- 1127 W Haworth Dr
- 1072 W Stonehaven Dr
- 114 Birmingham Ln
- 1002 W Stonehaven Dr Unit 108
- 452 N Kent Ln
- 448 Kent Dr
- 433 Kent Dr
- 273 Birmingham Ln
- 997 N Fox Hollow Dr
- 940 W Stonehaven Dr
- 1147 Ethnie Ct
- 920 W Stonehaven Dr
- 1052 Chidester Dr
- 954 N Picadilly Ct
- 875 Walton Dr
- 928 Amberly Dr
- 967 Amberly Dr
- 979 Amberly Dr
- 720 N Skipton Dr
- 716 N Skipton Dr
- 726 N Skipton Dr
- 716 N Skipton Dr
- 726 N Skipton Dr
- 732 N Skipton Dr
- 710 N Skipton Dr
- 710 N Skipton Dr
- 723 Leeds Ct
- 729 Leeds Ct
- 738 N Skipton Dr
- 735 Leeds Ct
- 738 Skipton Dr W
- 738 N Skipton Dr
- 711 Leeds Ct
- 721 N Skipton Dr
- 731 N Skipton Dr
- 715 N Skipton Dr
- 721 N Skipton Dr
- 731 Skipton Dr W