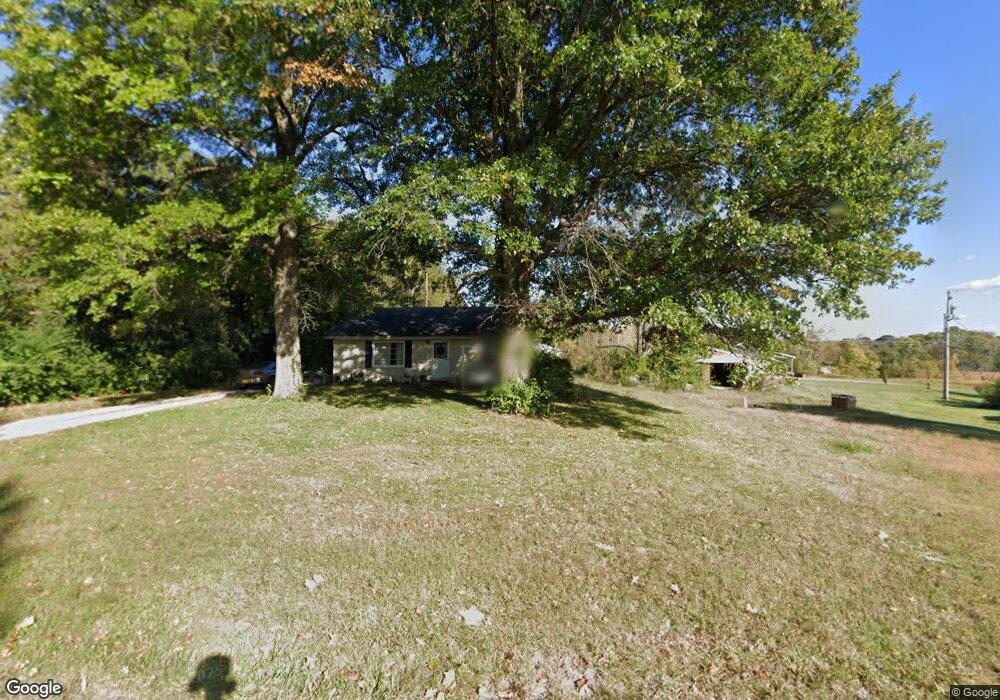
720 Villa Dr Belleville, IL 62223
Estimated Value: $90,111 - $128,000
Studio
--
Bath
980
Sq Ft
$113/Sq Ft
Est. Value
About This Home
This home is located at 720 Villa Dr, Belleville, IL 62223 and is currently estimated at $110,778, approximately $113 per square foot. 720 Villa Dr is a home located in St. Clair County with nearby schools including Ellis Elementary School, Emge Junior High School, and Our Lady Queen Of Peace Catholic School.
Ownership History
Date
Name
Owned For
Owner Type
Purchase Details
Closed on
Mar 28, 2024
Sold by
Alexander Julie A and Mary A Alexander Trust Mary A Alexander Trust
Bought by
Richardson James
Current Estimated Value
Purchase Details
Closed on
Jun 13, 2023
Sold by
Wasko-Alexander Lora
Bought by
Wasko-Alexander Lora and Lora Wasko-Alexander Trust
Purchase Details
Closed on
Jul 3, 2019
Sold by
Alexander Lora W
Bought by
Wasko Alexander James L and Wasko Alexander Lora
Purchase Details
Closed on
Jul 31, 2013
Sold by
Harold L Zaring Revocable Trust
Bought by
Floyd Darrell L and Floyd Jill D
Purchase Details
Closed on
Apr 24, 2013
Sold by
Harold L Zaring Revocable Trust and Heet Jeff
Bought by
Braun Kyle R
Purchase Details
Closed on
Nov 1, 2012
Sold by
Alexander James and Alexander Lora W
Bought by
Alexander Lora Wasko
Purchase Details
Closed on
Sep 10, 2012
Sold by
Bonifield Jerald J
Bought by
Alexander James and Alexander Lora W
Create a Home Valuation Report for This Property
The Home Valuation Report is an in-depth analysis detailing your home's value as well as a comparison with similar homes in the area
Home Values in the Area
Average Home Value in this Area
Purchase History
| Date | Buyer | Sale Price | Title Company |
|---|---|---|---|
| Richardson James | $15,000 | Town & Country Title | |
| Wasko-Alexander Lora | -- | None Available | |
| Wasko-Alexander Lora | -- | None Available | |
| Wasko Alexander James L | -- | Attorney | |
| Floyd Darrell L | $3,500 | Accent Title Inc | |
| Braun Kyle R | $50,000 | Accent Title Inc | |
| Alexander Lora Wasko | -- | None Available | |
| Alexander James | -- | None Available |
Source: Public Records
Tax History
| Year | Tax Paid | Tax Assessment Tax Assessment Total Assessment is a certain percentage of the fair market value that is determined by local assessors to be the total taxable value of land and additions on the property. | Land | Improvement |
|---|---|---|---|---|
| 2024 | $1,453 | $20,371 | $6,298 | $14,073 |
| 2023 | $1,367 | $18,278 | $5,651 | $12,627 |
| 2022 | $1,297 | $16,586 | $5,128 | $11,458 |
| 2021 | $1,254 | $15,399 | $4,761 | $10,638 |
| 2020 | $407 | $4,869 | $3,408 | $1,461 |
| 2019 | $402 | $4,869 | $3,408 | $1,461 |
| 2018 | $389 | $4,653 | $3,257 | $1,396 |
| 2017 | $680 | $4,333 | $3,033 | $1,300 |
| 2016 | $982 | $11,871 | $4,123 | $7,748 |
| 2014 | $911 | $11,939 | $4,147 | $7,792 |
| 2013 | $1,484 | $12,737 | $4,424 | $8,313 |
Source: Public Records
Map
Nearby Homes
- 632 Fern Dr
- 636 Fern Dr
- 400 Conniston Dr
- 512 Belvedere Dr
- 616 Ardmore Dr
- 208 Cascade Dr
- 6 Cat Tail Ct
- 100 Cascade Dr
- 8100 Excellence Place
- 8310 Old Saint Louis Rd
- 8754 Le Pere School Rd
- 101 Sheffield Dr
- 120 Lynnhaven Dr
- 860 Wilshire Dr
- 5 Cheshire Dr
- 13 Chamberlain Ct
- 125 Chevy Chase Dr
- 10 Chamberlain Ct
- 616 Oak Hill Dr
- 37 Dorchester Dr
Your Personal Tour Guide
Ask me questions while you tour the home.