720 W 2200 N Woods Cross, UT 84087
Estimated Value: $498,000 - $534,000
5
Beds
4
Baths
1,187
Sq Ft
$436/Sq Ft
Est. Value
About This Home
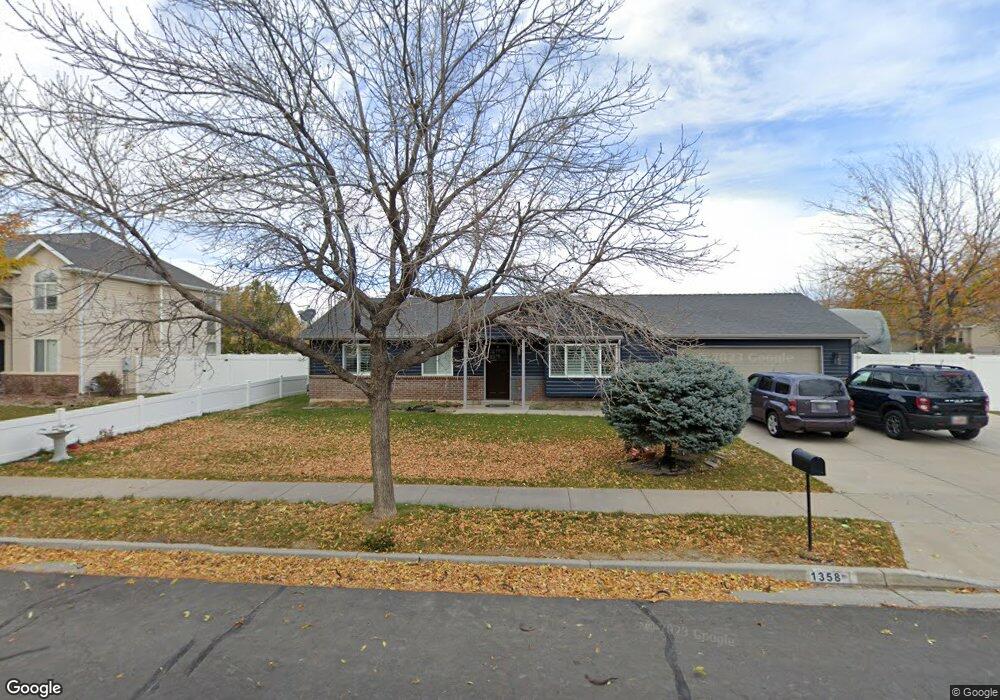
This home is located at 720 W 2200 N, Woods Cross, UT 84087 and is currently estimated at $517,372, approximately $435 per square foot. 720 W 2200 N is a home located in Davis County with nearby schools including West Bountiful Elementary School, Bountiful Junior High School, and Viewmont High School.
Ownership History
Date
Name
Owned For
Owner Type
Purchase Details
Closed on
Sep 13, 2022
Sold by
Sandorf Joel D and Sandorf Angela T
Bought by
Stewart Quin and Stewart Savana Weaver
Current Estimated Value
Home Financials for this Owner
Home Financials are based on the most recent Mortgage that was taken out on this home.
Original Mortgage
$428,450
Outstanding Balance
$408,657
Interest Rate
5.22%
Mortgage Type
New Conventional
Estimated Equity
$108,715
Purchase Details
Closed on
May 26, 2000
Sold by
Jones Timo B and Jones Judy A
Bought by
Sandorf Joel D and Sandorf Angela T
Home Financials for this Owner
Home Financials are based on the most recent Mortgage that was taken out on this home.
Original Mortgage
$145,000
Interest Rate
8.08%
Mortgage Type
Stand Alone First
Purchase Details
Closed on
May 22, 1997
Sold by
Jones Timo B
Bought by
Finn Development Llc
Create a Home Valuation Report for This Property
The Home Valuation Report is an in-depth analysis detailing your home's value as well as a comparison with similar homes in the area
Home Values in the Area
Average Home Value in this Area
Purchase History
| Date | Buyer | Sale Price | Title Company |
|---|---|---|---|
| Stewart Quin | -- | North Title | |
| Sandorf Joel D | -- | Bonneville Title Company Inc | |
| Finn Development Llc | -- | -- |
Source: Public Records
Mortgage History
| Date | Status | Borrower | Loan Amount |
|---|---|---|---|
| Open | Stewart Quin | $428,450 | |
| Previous Owner | Sandorf Joel D | $145,000 | |
| Closed | Sandorf Joel D | $14,500 |
Source: Public Records
Tax History Compared to Growth
Tax History
| Year | Tax Paid | Tax Assessment Tax Assessment Total Assessment is a certain percentage of the fair market value that is determined by local assessors to be the total taxable value of land and additions on the property. | Land | Improvement |
|---|---|---|---|---|
| 2025 | $2,798 | $263,450 | $130,628 | $132,822 |
| 2024 | $2,609 | $250,250 | $107,352 | $142,898 |
| 2023 | $2,519 | $440,000 | $203,555 | $236,445 |
| 2022 | $2,364 | $418,000 | $176,843 | $241,157 |
| 2021 | $2,054 | $307,000 | $130,525 | $176,475 |
| 2020 | $1,821 | $270,000 | $121,646 | $148,354 |
| 2019 | $1,790 | $261,000 | $123,169 | $137,831 |
| 2018 | $1,673 | $240,000 | $124,011 | $115,989 |
| 2016 | $1,456 | $111,375 | $31,879 | $79,496 |
| 2015 | $1,415 | $102,300 | $31,879 | $70,421 |
| 2014 | $1,419 | $104,874 | $31,879 | $72,995 |
| 2013 | -- | $96,932 | $30,289 | $66,643 |
Source: Public Records
Map
Nearby Homes
- 668 W 2300 N
- 2257 N 830 W
- 637 W 1600 N
- 988 W 1950 N Unit 134
- 548 S 675 W
- 324 S 600 W
- 1084 W Audrey Ln Unit 20
- 1084 W Audrey Ln
- 239 Lyman Ln
- 234 Leah Cir
- 204 Lyman Ln
- 825 W 1320 N
- Lincoln Farmhouse Plan at Belmont Farms
- Belmont Traditional Plan at Belmont Farms
- Hampton Traditional Plan at Belmont Farms
- 2 S 285 W
- 117 Cara Vella Ln
- 638 N 800 W
- 1552 N 200 W
- 88 W 50 S Unit D-5