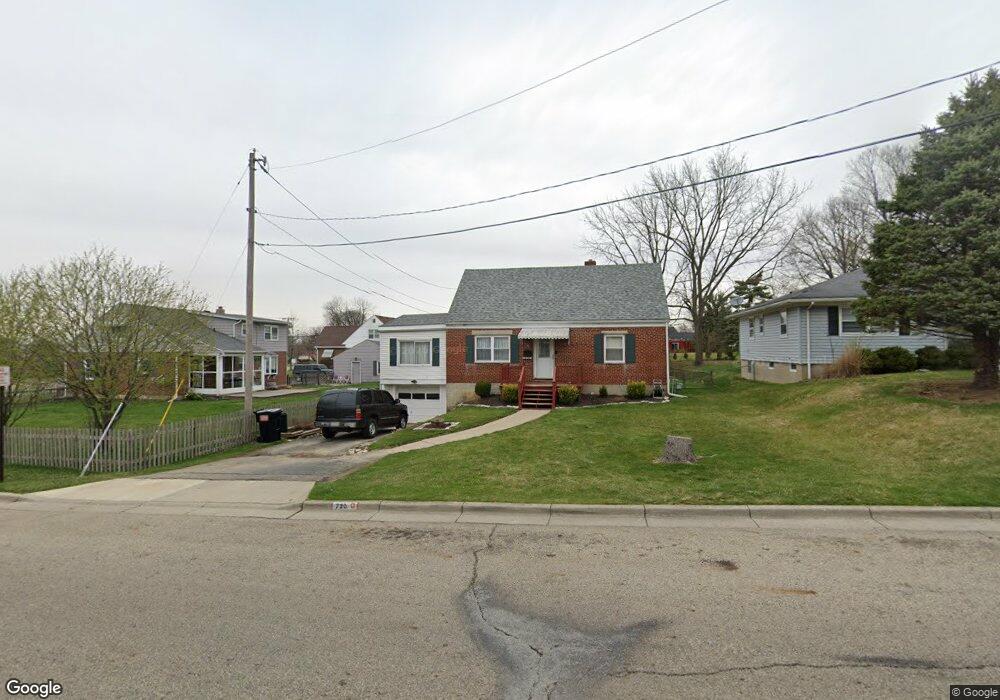
720 W Harding Rd Springfield, OH 45504
Estimated Value: $191,000 - $220,933
3
Beds
2
Baths
1,142
Sq Ft
$185/Sq Ft
Est. Value
About This Home
This home is located at 720 W Harding Rd, Springfield, OH 45504 and is currently estimated at $210,733, approximately $184 per square foot. 720 W Harding Rd is a home located in Clark County with nearby schools including Snowhill Elementary School, Roosevelt Middle School, and Springfield High School.
Ownership History
Date
Name
Owned For
Owner Type
Purchase Details
Closed on
May 4, 2001
Sold by
Howell Scott A and Howell Angella L
Bought by
Howell Christopher P
Current Estimated Value
Home Financials for this Owner
Home Financials are based on the most recent Mortgage that was taken out on this home.
Original Mortgage
$80,000
Outstanding Balance
$29,783
Interest Rate
6.99%
Mortgage Type
Purchase Money Mortgage
Estimated Equity
$180,950
Purchase Details
Closed on
Jun 30, 1999
Sold by
Howell Scott A and Howell Angella L
Bought by
Howell Christopher Paul and Howell Korki Elizabeth
Home Financials for this Owner
Home Financials are based on the most recent Mortgage that was taken out on this home.
Original Mortgage
$64,000
Interest Rate
7.12%
Mortgage Type
Seller Take Back
Purchase Details
Closed on
Aug 24, 1993
Create a Home Valuation Report for This Property
The Home Valuation Report is an in-depth analysis detailing your home's value as well as a comparison with similar homes in the area
Home Values in the Area
Average Home Value in this Area
Purchase History
| Date | Buyer | Sale Price | Title Company |
|---|---|---|---|
| Howell Christopher P | $80,000 | Park Place Title Agency | |
| Howell Christopher Paul | $80,000 | -- | |
| -- | $69,500 | -- |
Source: Public Records
Mortgage History
| Date | Status | Borrower | Loan Amount |
|---|---|---|---|
| Open | Howell Christopher P | $80,000 | |
| Previous Owner | Howell Christopher Paul | $64,000 |
Source: Public Records
Tax History Compared to Growth
Tax History
| Year | Tax Paid | Tax Assessment Tax Assessment Total Assessment is a certain percentage of the fair market value that is determined by local assessors to be the total taxable value of land and additions on the property. | Land | Improvement |
|---|---|---|---|---|
| 2024 | $2,740 | $56,860 | $7,940 | $48,920 |
| 2023 | $2,740 | $56,860 | $7,940 | $48,920 |
| 2022 | $2,807 | $56,860 | $7,940 | $48,920 |
| 2021 | $2,258 | $42,230 | $5,880 | $36,350 |
| 2020 | $2,263 | $42,230 | $5,880 | $36,350 |
| 2019 | $2,269 | $42,230 | $5,880 | $36,350 |
| 2018 | $2,507 | $44,690 | $8,650 | $36,040 |
| 2017 | $2,506 | $40,051 | $8,645 | $31,406 |
| 2016 | $2,509 | $40,051 | $8,645 | $31,406 |
| 2015 | $2,544 | $39,638 | $8,232 | $31,406 |
| 2014 | $2,533 | $39,638 | $8,232 | $31,406 |
| 2013 | $2,506 | $39,638 | $8,232 | $31,406 |
Source: Public Records
Map
Nearby Homes
- 718 W Harding Rd
- 1730 Saint Paris Pike
- 1750 Saint Paris Pike
- 710 W Harding Rd
- 721 W Harding Rd
- 723 W Harding Rd
- 731 W Harding Rd
- 727 Mayhill Rd
- 725 Mayhill Rd
- 1770 Saint Paris Pike
- 707 W Harding Rd
- 735 W Harding Rd
- 709 Mayhill Rd
- 701 Mayhill Rd
- 648 W Harding Rd
- 647 Mayhill Rd
- 720 Riverside Dr
- 643 Mayhill Rd
- 1737 Fairway Dr
- 730 Riverside Dr