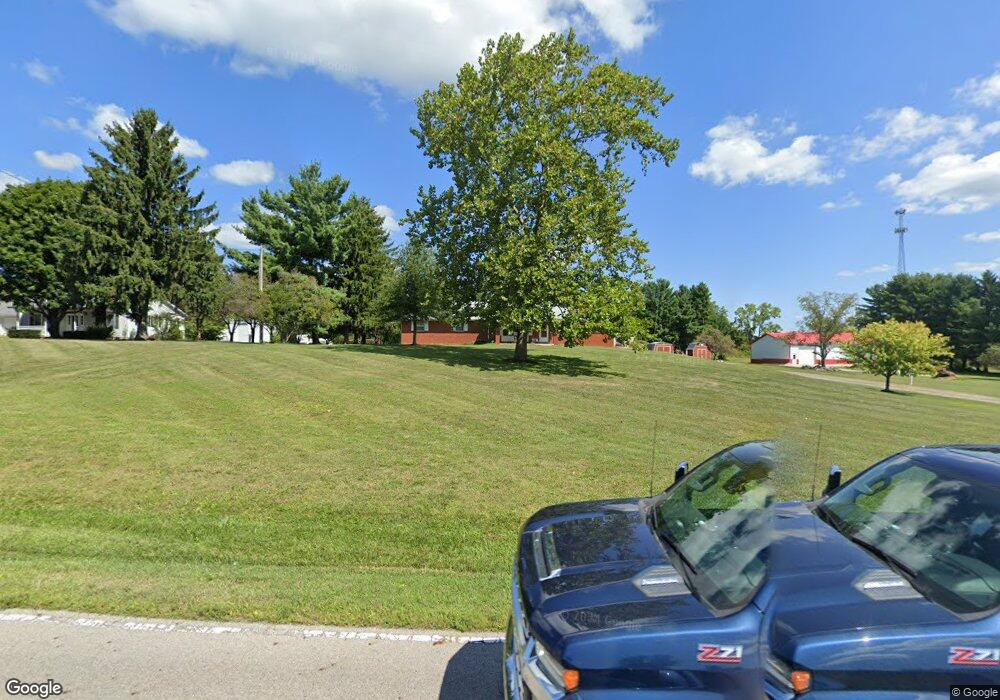
7200 Marcy Rd NW Lancaster, OH 43130
Bloom NeighborhoodEstimated Value: $379,000 - $503,000
3
Beds
2
Baths
1,344
Sq Ft
$312/Sq Ft
Est. Value
About This Home
This home is located at 7200 Marcy Rd NW, Lancaster, OH 43130 and is currently estimated at $419,213, approximately $311 per square foot. 7200 Marcy Rd NW is a home located in Fairfield County with nearby schools including Bloom Carroll Primary School, Bloom Carroll Intermediate School, and Bloom-Carroll Middle School.
Ownership History
Date
Name
Owned For
Owner Type
Purchase Details
Closed on
Mar 30, 2023
Sold by
Cain Kathy A and Cain Gary D
Bought by
Cain Gary D and Cain Kathy A
Current Estimated Value
Purchase Details
Closed on
Mar 24, 2023
Sold by
Cain Kathy A and Cain Gary D
Bought by
Cain Gary D and Cain Kathy A
Purchase Details
Closed on
Nov 6, 2003
Sold by
Cain Gary D
Bought by
Cain Kathy A
Purchase Details
Closed on
Sep 19, 2001
Sold by
Bailey Dean A
Bought by
Cain Gary D
Home Financials for this Owner
Home Financials are based on the most recent Mortgage that was taken out on this home.
Original Mortgage
$100,000
Interest Rate
6.61%
Mortgage Type
New Conventional
Purchase Details
Closed on
Jul 27, 1995
Sold by
Gossman Douglas P
Bought by
Bailey Dean A and Bailey Denise A
Home Financials for this Owner
Home Financials are based on the most recent Mortgage that was taken out on this home.
Original Mortgage
$118,700
Interest Rate
7.59%
Mortgage Type
New Conventional
Purchase Details
Closed on
Mar 10, 1992
Sold by
Gossman Douglas P
Bought by
Gossman Douglas P
Create a Home Valuation Report for This Property
The Home Valuation Report is an in-depth analysis detailing your home's value as well as a comparison with similar homes in the area
Home Values in the Area
Average Home Value in this Area
Purchase History
| Date | Buyer | Sale Price | Title Company |
|---|---|---|---|
| Cain Gary D | -- | None Listed On Document | |
| Cain Gary D | -- | -- | |
| Cain Kathy A | -- | -- | |
| Cain Gary D | $175,000 | -- | |
| Bailey Dean A | $125,000 | -- | |
| Gossman Douglas P | -- | -- |
Source: Public Records
Mortgage History
| Date | Status | Borrower | Loan Amount |
|---|---|---|---|
| Previous Owner | Cain Gary D | $100,000 | |
| Previous Owner | Bailey Dean A | $118,700 |
Source: Public Records
Tax History Compared to Growth
Tax History
| Year | Tax Paid | Tax Assessment Tax Assessment Total Assessment is a certain percentage of the fair market value that is determined by local assessors to be the total taxable value of land and additions on the property. | Land | Improvement |
|---|---|---|---|---|
| 2024 | $10,672 | $129,520 | $37,060 | $92,460 |
| 2023 | $5,269 | $121,590 | $37,060 | $84,530 |
| 2022 | $4,490 | $102,840 | $28,350 | $74,490 |
| 2021 | $3,580 | $74,130 | $22,680 | $51,450 |
| 2020 | $3,580 | $74,130 | $22,680 | $51,450 |
| 2019 | $3,553 | $74,130 | $22,680 | $51,450 |
| 2018 | $2,926 | $54,900 | $19,050 | $35,850 |
| 2017 | $2,758 | $61,780 | $18,140 | $43,640 |
| 2016 | $2,717 | $61,780 | $18,140 | $43,640 |
| 2015 | $2,616 | $57,830 | $18,140 | $39,690 |
| 2014 | $2,510 | $57,830 | $18,140 | $39,690 |
| 2013 | $2,510 | $57,830 | $18,140 | $39,690 |
Source: Public Records
Map
Nearby Homes
- 839 Rockmill Rd NW
- 7835 E Ohio State Ln NW
- 1975 Lamb Rd NW
- 7985 Lithopolis Rd NW
- 8642 Water St
- 10 Mount Zion Rd NW
- 681 Mount Zion Rd SW
- 9605 Royalton Rd SW
- 8416 Royalton Rd SW
- 8245 Royalton Rd SW
- 8143 Royalton Rd SW
- 4180 Stone Hill Drive East NW
- 8322 Benson Rd
- 2155 Carroll-Southern Rd NW
- 6920 Winchester Rd NW
- 3355 Old Columbus Rd NW
- 4900 Pickerington Rd NW
- 5701 Lancaster-Circleville Rd SW
- 3076 Lithopolis Rd NW
- 52 W Canal St
- 7230 Marcy Rd NW
- 7260 Marcy Rd NW
- 7300 Marcy Rd NW
- 7334 Marcy Rd NW
- 7333 Marcy Rd NW
- 7107 Marcy Rd NW
- 7340 Marcy Rd NW
- 927 Rockmill Rd NW
- 515 Rock Mill Rd
- 1150 Rock Mill Rd
- 7337 Marcy Rd NW
- 7025 Marcy Rd NW
- 7390 Marcy Rd NW
- 955 Rockmill Rd NW
- 7400 Marcy Rd NW
- 897 Rockmill Rd NW
- 1271 Walker Dr NW
- 7415 Marcy Rd NW
- 1292 Walker Dr NW
- 1025 Rockmill Rd NW