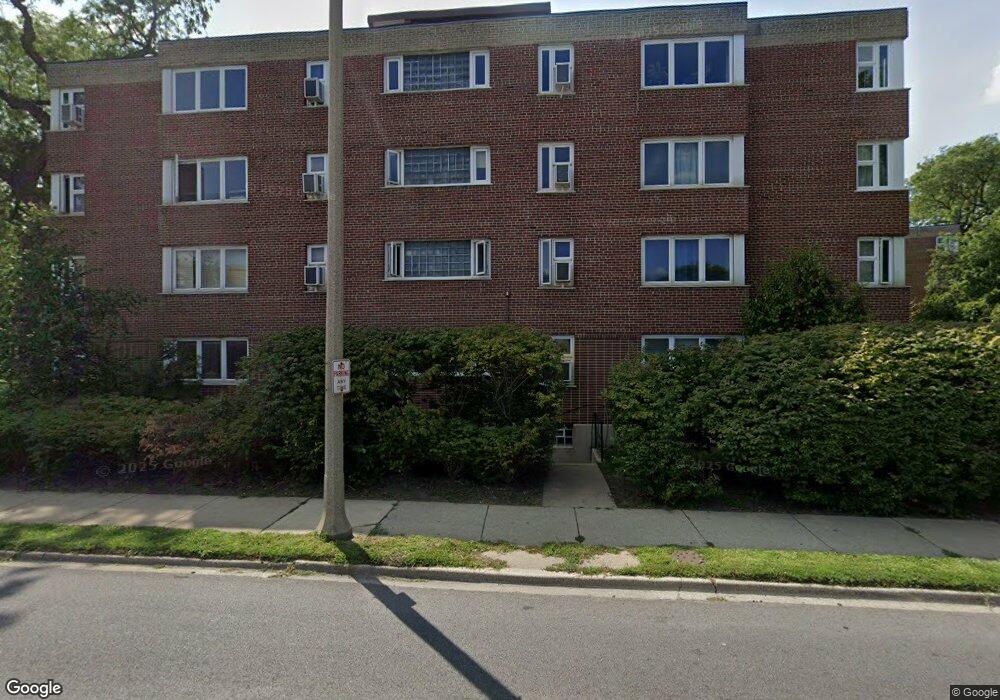
River Forest Garden Condominium 7200 Oak Ave Unit 72004N River Forest, IL 60305
Estimated Value: $113,000 - $133,000
1
Bed
1
Bath
796
Sq Ft
$153/Sq Ft
Est. Value
About This Home
This home is located at 7200 Oak Ave Unit 72004N, River Forest, IL 60305 and is currently estimated at $121,534, approximately $152 per square foot. 7200 Oak Ave Unit 72004N is a home located in Cook County with nearby schools including Roosevelt Middle School, Lincoln Elementary School, and Oak Park and River Forest High School.
Ownership History
Date
Name
Owned For
Owner Type
Purchase Details
Closed on
May 3, 2023
Sold by
Hogan Valerie
Bought by
Oak 4Nw Llc
Current Estimated Value
Purchase Details
Closed on
Oct 27, 2022
Sold by
Susan Dwyer-Marshall And Bob Marshall Tr
Bought by
Hogan Valerie and Neff Miriam
Purchase Details
Closed on
Oct 8, 2012
Sold by
Grapsas Nicholas G
Bought by
Morley Michael P and Morley Dorothy B
Purchase Details
Closed on
Sep 23, 2008
Sold by
Dwyer Marshall Susan and Marshall Robert J
Bought by
Dwyer Marshall Susan and Marshall Bob
Purchase Details
Closed on
Nov 24, 1993
Sold by
Mcmahon Jo Stone
Bought by
Dwyer Susan J
Home Financials for this Owner
Home Financials are based on the most recent Mortgage that was taken out on this home.
Original Mortgage
$32,800
Interest Rate
6.82%
Create a Home Valuation Report for This Property
The Home Valuation Report is an in-depth analysis detailing your home's value as well as a comparison with similar homes in the area
Home Values in the Area
Average Home Value in this Area
Purchase History
| Date | Buyer | Sale Price | Title Company |
|---|---|---|---|
| Oak 4Nw Llc | -- | None Listed On Document | |
| Hogan Valerie | $90,000 | Fidelity National Title | |
| Morley Michael P | $27,000 | Stewart Title Company | |
| Dwyer Marshall Susan | -- | None Available | |
| Dwyer Susan J | $27,333 | -- |
Source: Public Records
Mortgage History
| Date | Status | Borrower | Loan Amount |
|---|---|---|---|
| Previous Owner | Dwyer Susan J | $32,800 |
Source: Public Records
Tax History
| Year | Tax Paid | Tax Assessment Tax Assessment Total Assessment is a certain percentage of the fair market value that is determined by local assessors to be the total taxable value of land and additions on the property. | Land | Improvement |
|---|---|---|---|---|
| 2025 | $2,347 | $8,572 | $1,046 | $7,526 |
| 2024 | $2,347 | $8,572 | $1,046 | $7,526 |
| 2023 | $1,810 | $8,572 | $1,046 | $7,526 |
| 2022 | $1,810 | $5,605 | $1,107 | $4,498 |
| 2021 | $1,743 | $5,604 | $1,106 | $4,498 |
| 2020 | $1,703 | $5,604 | $1,106 | $4,498 |
| 2019 | $1,773 | $5,712 | $1,005 | $4,707 |
| 2018 | $2,220 | $7,553 | $1,005 | $6,548 |
| 2017 | $2,212 | $7,553 | $1,005 | $6,548 |
| 2016 | $1,422 | $4,419 | $845 | $3,574 |
| 2015 | $1,397 | $4,419 | $845 | $3,574 |
| 2014 | $1,279 | $4,419 | $845 | $3,574 |
| 2013 | $1,461 | $5,179 | $845 | $4,334 |
Source: Public Records
About River Forest Garden Condominium
Map
Nearby Homes
- 7200 Oak Ave Unit 3NW
- 7210 Oak Ave Unit 4SW
- 7208 Oak Ave Unit 2SE
- 7204 Oak Ave Unit 1NW
- 425 N Maple Ave
- 300 N Maple Ave
- 403 N Marion St Unit 3D
- 1125 Erie St
- 1146 Ontario St Unit 1E
- 227 N Marion St
- 420 N Marion St
- 1038 Superior St Unit 1W
- 1103 Holly Ct Unit 306
- 510 Bonnie Brae Place Unit K3
- 940 Bonnie Brae Place
- 7348 Lake St Unit 2E
- 618 Monroe Ave
- 1010 N Harlem Ave Unit 504
- 514 William St
- 711 Jackson Ave
- 7200 Oak Ave Unit 1NW
- 7200 Oak Ave Unit 72002S
- 7200 Oak Ave Unit 72002S
- 7200 Oak Ave Unit 72002N
- 7200 Oak Ave Unit 72003S
- 7200 Oak Ave Unit 72002N
- 7200 Oak Ave Unit 72004S
- 7200 Oak Ave Unit 72001N
- 7200 Oak Ave Unit 72004S
- 7200 Oak Ave Unit 72003N
- 7200 Oak Ave Unit 72003S
- 7200 Oak Ave Unit 72001S
- 7200 Oak Ave Unit 72001N
- 7200 Oak Ave Unit 72004N
- 7200 Oak Ave Unit 72003N
- 7200 Oak Ave Unit 72001S
- 7200 Oak Ave
- 7200 Oak Ave Unit 2NE
- 7200 Oak Ave Unit 2NW
- 7200 Oak Ave Unit 2SW
Your Personal Tour Guide
Ask me questions while you tour the home.