Estimated Value: $553,131 - $660,000
5
Beds
4
Baths
4,400
Sq Ft
$138/Sq Ft
Est. Value
About This Home
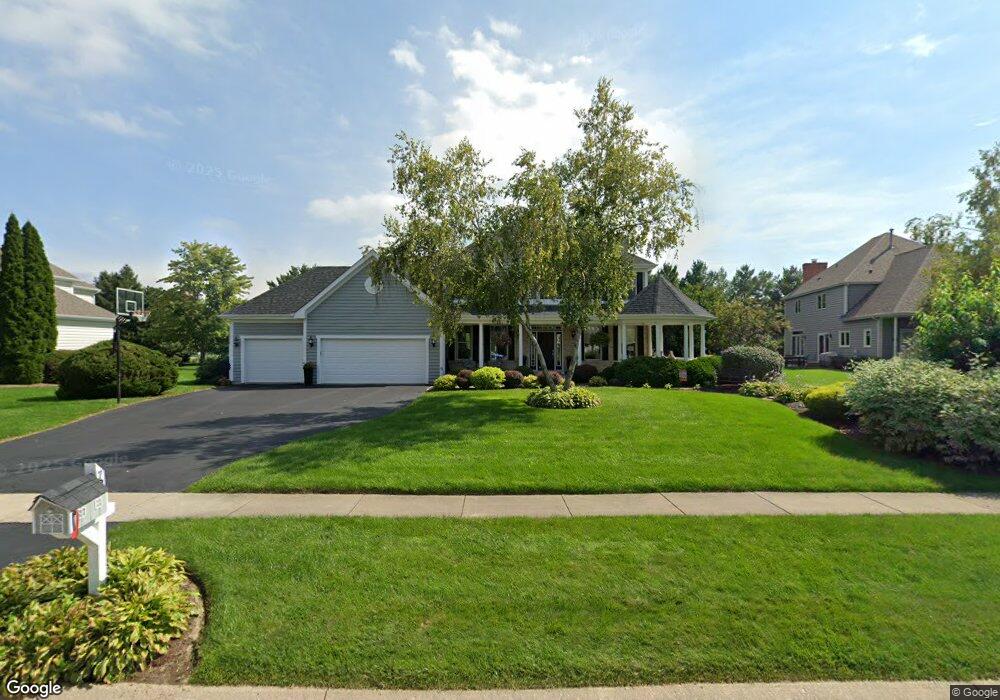
This home is located at 7200 Swallow Way, Cary, IL 60013 and is currently estimated at $607,283, approximately $138 per square foot. 7200 Swallow Way is a home located in McHenry County with nearby schools including Three Oaks Elementary School, Cary Jr High School, and Cary-Grove High School.
Ownership History
Date
Name
Owned For
Owner Type
Purchase Details
Closed on
Feb 27, 2006
Sold by
Jenkins Michael S and Jenkins Juliana M
Bought by
Richards Gregory and Richards Amy
Current Estimated Value
Home Financials for this Owner
Home Financials are based on the most recent Mortgage that was taken out on this home.
Original Mortgage
$412,800
Outstanding Balance
$233,711
Interest Rate
6.2%
Mortgage Type
Fannie Mae Freddie Mac
Estimated Equity
$373,572
Purchase Details
Closed on
Jul 1, 2000
Sold by
Vande Logt Construction Co
Bought by
Jenkins Michael S and Jenkins Juliana M
Home Financials for this Owner
Home Financials are based on the most recent Mortgage that was taken out on this home.
Original Mortgage
$330,000
Interest Rate
8.12%
Purchase Details
Closed on
Mar 10, 2000
Sold by
Harris Bank Barrington
Bought by
Vande Logt Construction Co
Create a Home Valuation Report for This Property
The Home Valuation Report is an in-depth analysis detailing your home's value as well as a comparison with similar homes in the area
Home Values in the Area
Average Home Value in this Area
Purchase History
| Date | Buyer | Sale Price | Title Company |
|---|---|---|---|
| Richards Gregory | $516,000 | First American Title Ins Co | |
| Jenkins Michael S | $416,633 | -- | |
| Vande Logt Construction Co | $55,000 | -- |
Source: Public Records
Mortgage History
| Date | Status | Borrower | Loan Amount |
|---|---|---|---|
| Open | Richards Gregory | $412,800 | |
| Previous Owner | Jenkins Michael S | $330,000 |
Source: Public Records
Tax History
| Year | Tax Paid | Tax Assessment Tax Assessment Total Assessment is a certain percentage of the fair market value that is determined by local assessors to be the total taxable value of land and additions on the property. | Land | Improvement |
|---|---|---|---|---|
| 2024 | $12,983 | $170,408 | $27,354 | $143,054 |
| 2023 | $12,705 | $152,409 | $24,465 | $127,944 |
| 2022 | $13,439 | $156,862 | $38,986 | $117,876 |
| 2021 | $12,830 | $146,136 | $36,320 | $109,816 |
| 2020 | $12,459 | $140,962 | $35,034 | $105,928 |
| 2019 | $12,220 | $134,918 | $33,532 | $101,386 |
| 2018 | $12,048 | $129,987 | $30,976 | $99,011 |
| 2017 | $12,566 | $129,708 | $29,181 | $100,527 |
| 2016 | $12,496 | $121,654 | $27,369 | $94,285 |
| 2013 | -- | $119,296 | $25,532 | $93,764 |
Source: Public Records
Map
Nearby Homes
- Lot 10 Grove Ln
- Lot 11 Grove Ln
- 365 Oakmont Dr
- LOT 02 Three Oaks Rd
- 331 Parkstone Dr
- 612 3 Oaks Rd
- 47 Sunset Dr
- 145 Sherwood Dr
- 1005 Hilary Ln
- 26 Wagner Dr
- 0000 Newbold Rd
- 124 E Main St
- 128 E Main St
- 330 Park Ave
- 6606 Silver Lake Rd
- 461 W Oriole Trail
- Lots 2,3,4 Northwest Hwy
- 1107 Spring Beach Way
- 9 Bordeaux Ct
- 24881 N Black Walnut
- 7108 Swallow Way
- 7202 Swallow Way
- 7106 Swallow Way
- 7201 Nighthawk Way
- 7103 Nighthawk Way
- 7203 Nighthawk Way
- 7111 Swallow Way
- 7201 Swallow Way
- 7104 Swallow Way
- 7109 Swallow Way
- 1405 Stag Trail
- 1407 Stag Trail
- 7107 Swallow Way
- 1501 Stag Trail
- 1401 Stag Trail
- 7105 Swallow Way
- 7102 Swallow Way
- 7200 Nighthawk Way
- 1305 Cougar Trail
- 1304 Cougar Trail