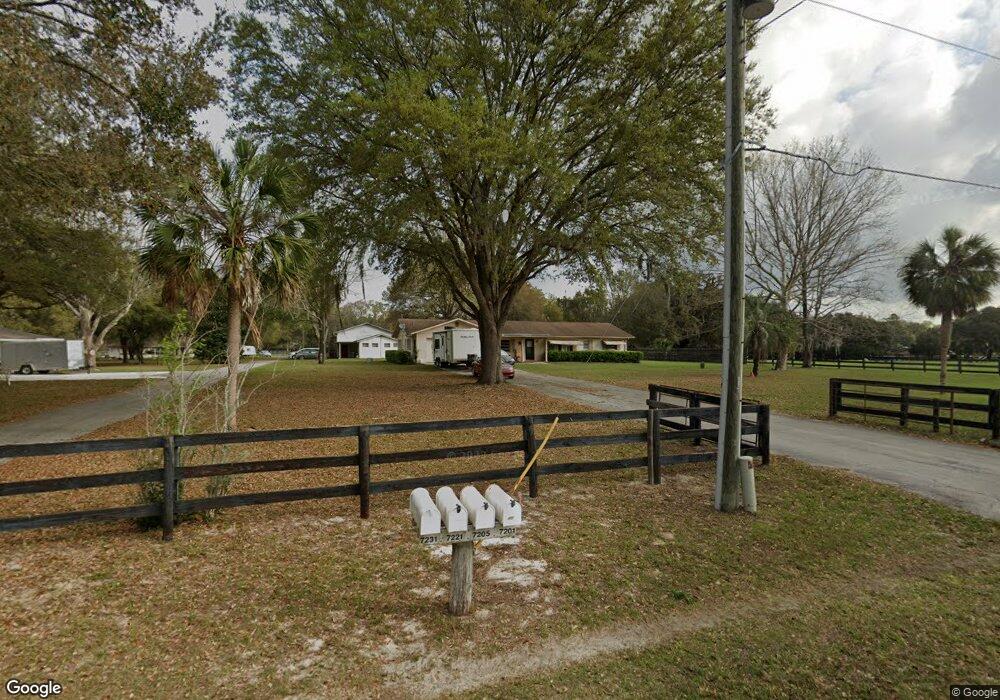
7201 SW 83rd Place Unit 7205 Ocala, FL 34476
Fellowship NeighborhoodEstimated Value: $338,000 - $422,752
5
Beds
5
Baths
3,858
Sq Ft
$102/Sq Ft
Est. Value
About This Home
This home is located at 7201 SW 83rd Place Unit 7205, Ocala, FL 34476 and is currently estimated at $394,188, approximately $102 per square foot. 7201 SW 83rd Place Unit 7205 is a home located in Marion County with nearby schools including Hammett Bowen Jr. Elementary School, Liberty Middle School, and West Port High School.
Ownership History
Date
Name
Owned For
Owner Type
Purchase Details
Closed on
Jun 20, 2024
Sold by
Gochenour Sarah A and Gochenour Marvin M
Bought by
Gochenour Sarah A and Mozina Deborah Ruth
Current Estimated Value
Purchase Details
Closed on
Jun 17, 2021
Sold by
Gochenour Marvin M and Gochenour Sarah A
Bought by
Gochenour Marvin M and Gochenour Sarah A
Purchase Details
Closed on
Jul 31, 2013
Sold by
Gochenour Marvin M and Gochenour Sarah A
Bought by
Gochenour Marvin M and Gochenour Sarah A
Purchase Details
Closed on
Jan 5, 2012
Sold by
Gochenour Marvin M and Gochenour Sarah A
Bought by
Gochenour Marvin M and Gochenour Sarah A
Purchase Details
Closed on
Apr 9, 2010
Sold by
Gochenour Marvin M and Gochenour Sarah A
Bought by
The Gochenour Family Trust
Create a Home Valuation Report for This Property
The Home Valuation Report is an in-depth analysis detailing your home's value as well as a comparison with similar homes in the area
Home Values in the Area
Average Home Value in this Area
Purchase History
| Date | Buyer | Sale Price | Title Company |
|---|---|---|---|
| Gochenour Sarah A | $100 | None Listed On Document | |
| Gochenour Sarah A | $100 | None Listed On Document | |
| Gochenour Sarah A | $100 | None Listed On Document | |
| Gochenour Sarah A | $100 | None Listed On Document | |
| Gochenour Marvin M | -- | Accommodation | |
| Gochenour Marvin M | -- | None Available | |
| Gochenour Marvin M | -- | Attorney | |
| The Gochenour Family Trust | -- | None Available |
Source: Public Records
Tax History Compared to Growth
Tax History
| Year | Tax Paid | Tax Assessment Tax Assessment Total Assessment is a certain percentage of the fair market value that is determined by local assessors to be the total taxable value of land and additions on the property. | Land | Improvement |
|---|---|---|---|---|
| 2024 | $5,078 | $244,916 | -- | -- |
| 2023 | $4,645 | $222,677 | $0 | $0 |
| 2022 | $4,295 | $202,402 | $0 | $0 |
| 2021 | $3,895 | $184,011 | $24,727 | $159,284 |
| 2020 | $3,867 | $180,902 | $25,110 | $155,792 |
| 2019 | $3,810 | $175,537 | $21,848 | $153,689 |
| 2018 | $3,542 | $166,813 | $21,842 | $144,971 |
| 2017 | $3,518 | $164,797 | $25,104 | $139,693 |
| 2016 | $3,306 | $153,479 | $0 | $0 |
| 2015 | $3,197 | $145,406 | $0 | $0 |
| 2014 | $3,015 | $141,801 | $0 | $0 |
Source: Public Records
Map
Nearby Homes
- 7440 SW 83rd Place
- 8860 SW 68th Terrace
- 6871 SW 84th Place
- 7172 SW Highway 200
- 6848 SW 84th Place
- 8640 SW 73rd Ave
- 6588 SW 81st Loop
- 6561 SW 81st Loop
- 6567 SW 81st Loop
- 8202 SW 67th Ave
- 8188 SW 67th Ave
- 8182 SW 67th Ave
- 8196 SW 67th Ave
- 8200 SW 67th Ave
- 8190 SW 67th Ave
- 8194 SW 67th Ave
- 6571 SW 81st Loop
- 6573 SW 81st Loop
- PEARSON - Exterior Unit Plan at The Towns at Laurel Commons
- PEARSON - Interior Unit Plan at The Towns at Laurel Commons
- 7231 SW 83rd Place
- 7319 SW 83rd Place
- 7221 SW 83rd Place
- 7200 SW 83rd Place
- 7155 SW 83rd Place
- 7155 SW 83rd Place
- 7085 SW 83rd Place
- 8445 SW 73rd Ave
- 7167 SW State Road 200
- 7173 SW State Road 200
- 8455 SW 73rd Ave
- 8440 SW 73rd Ave
- 8940 SW State Road 200
- 8969 SW State Road 200
- 8480 SW 73rd Ave
- 7445 SW 83rd Place
- 8545 SW 73rd Ave
- 7201 SW Highway 200
- 7201 SW Highway 200
- 6961 SW Highway 200