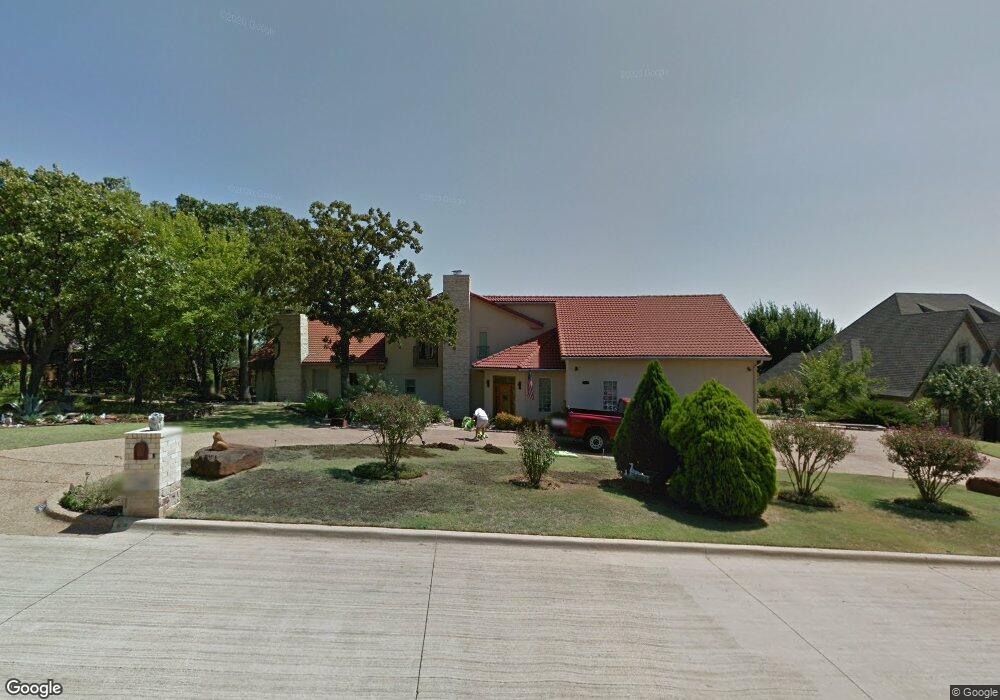
7201 Vanguard Ct Colleyville, TX 76034
Estimated Value: $1,032,449 - $1,241,000
4
Beds
3
Baths
4,112
Sq Ft
$271/Sq Ft
Est. Value
About This Home
This home is located at 7201 Vanguard Ct, Colleyville, TX 76034 and is currently estimated at $1,114,612, approximately $271 per square foot. 7201 Vanguard Ct is a home located in Tarrant County with nearby schools including Colleyville Elementary School, Cross Timbers Middle School, and Grapevine High School.
Ownership History
Date
Name
Owned For
Owner Type
Purchase Details
Closed on
Jul 21, 2015
Sold by
Lukacsy Gene T and Lukacsy Helga E
Bought by
Kimbell Isham and Kimbell Christie
Current Estimated Value
Home Financials for this Owner
Home Financials are based on the most recent Mortgage that was taken out on this home.
Original Mortgage
$411,750
Outstanding Balance
$323,507
Interest Rate
4.08%
Mortgage Type
New Conventional
Estimated Equity
$791,105
Purchase Details
Closed on
Jul 2, 2009
Sold by
Lukacsy Gene and Lukacsy Helga
Bought by
Millman Phillip D and Millman Karla K
Purchase Details
Closed on
Jan 9, 2002
Sold by
Vanguard Estates Joint Venture
Bought by
Lukacsy Gene T and Lukacsy Helga E
Create a Home Valuation Report for This Property
The Home Valuation Report is an in-depth analysis detailing your home's value as well as a comparison with similar homes in the area
Home Values in the Area
Average Home Value in this Area
Purchase History
| Date | Buyer | Sale Price | Title Company |
|---|---|---|---|
| Kimbell Isham | -- | Old Republic Title | |
| Millman Phillip D | -- | None Available | |
| Lukacsy Gene T | -- | Rattikin Title Co |
Source: Public Records
Mortgage History
| Date | Status | Borrower | Loan Amount |
|---|---|---|---|
| Open | Kimbell Isham | $411,750 |
Source: Public Records
Tax History Compared to Growth
Tax History
| Year | Tax Paid | Tax Assessment Tax Assessment Total Assessment is a certain percentage of the fair market value that is determined by local assessors to be the total taxable value of land and additions on the property. | Land | Improvement |
|---|---|---|---|---|
| 2025 | $3,151 | $815,476 | $301,165 | $514,311 |
| 2024 | $3,151 | $815,476 | $301,165 | $514,311 |
| 2023 | $11,867 | $714,755 | $301,165 | $413,590 |
| 2022 | $12,631 | $639,535 | $301,165 | $338,370 |
| 2021 | $13,420 | $611,073 | $270,000 | $341,073 |
| 2020 | $13,639 | $613,776 | $270,000 | $343,776 |
| 2019 | $13,316 | $642,515 | $270,000 | $372,515 |
| 2018 | $3,113 | $523,575 | $270,000 | $253,575 |
| 2017 | $11,245 | $475,977 | $270,000 | $205,977 |
| 2016 | $11,692 | $494,889 | $270,000 | $224,889 |
| 2015 | -- | $408,065 | $168,750 | $239,315 |
| 2014 | -- | $330,200 | $162,000 | $168,200 |
Source: Public Records
Map
Nearby Homes
- 7115 Cast Iron Forest Trail
- 7212 John Mccain Rd
- 510 Bandit Trail
- 7400 John Mccain Rd
- 512 Bandit Trail
- 204 Old Grove Rd
- 7511 Mount Vernon Dr
- 7702 Tillman Hill Rd
- 7607 Monticello Pkwy
- 6912 Handel
- 6776 St Moritz Pkwy
- 6809 Strauss
- 3325 Creek Rd
- 6108 Westcoat Dr
- 7033 Benjamin
- 912 Chateau Ct
- 203 Polo Trail
- 1112 Rhett Dr
- 1205 Scenic Dr
- 1206 Oakwood Trail
- 7109 Vanguard Ct
- 7205 Vanguard Ct
- 7209 John Mccain Rd
- 7200 Vanguard Ct
- 7301 Vanguard Ct
- 7105 Vanguard Ct
- 7300 Vanguard Ct
- 7108 Vanguard Ct
- 7300 Chanel Ct
- 7100 Vanguard Ct
- 7305 Vanguard Ct
- 7304 Vanguard Ct
- 7104 Vanguard Ct
- 7205 Windswept Trail
- 7301 Chanel Ct
- 7304 Chanel Ct
- 7209 Windswept Trail
- 7201 Windswept Trail
- 7308 Vanguard Ct
- 7309 Vanguard Ct