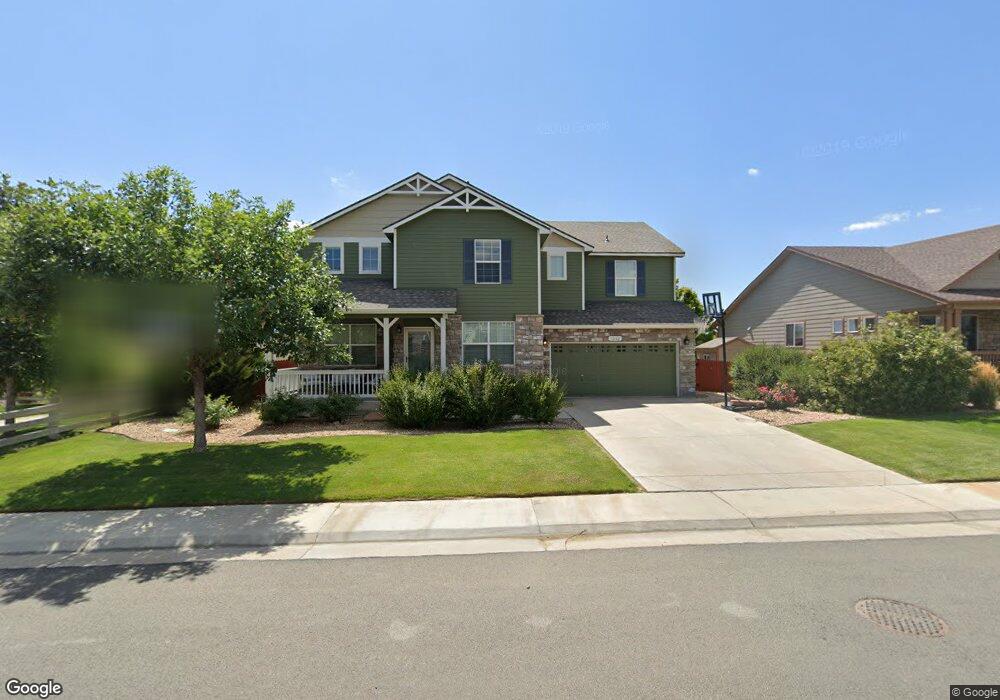
7202 E 132nd Ave Thornton, CO 80602
Estimated Value: $754,000 - $770,000
4
Beds
4
Baths
4,543
Sq Ft
$168/Sq Ft
Est. Value
About This Home
This home is located at 7202 E 132nd Ave, Thornton, CO 80602 and is currently estimated at $762,216, approximately $167 per square foot. 7202 E 132nd Ave is a home located in Adams County with nearby schools including West Ridge Elementary School, Rodger Quist Middle School, and Riverdale Ridge High School.
Ownership History
Date
Name
Owned For
Owner Type
Purchase Details
Closed on
Apr 13, 2020
Sold by
Ortega Samuel J and Ortega Natalie
Bought by
Gomez Gregory Aaron
Current Estimated Value
Home Financials for this Owner
Home Financials are based on the most recent Mortgage that was taken out on this home.
Original Mortgage
$509,000
Outstanding Balance
$446,977
Interest Rate
3.4%
Mortgage Type
New Conventional
Estimated Equity
$315,239
Purchase Details
Closed on
Dec 8, 2010
Sold by
Closser Jd and Closser Holley C
Bought by
Ortega Samuel J and Ortega Natalie
Home Financials for this Owner
Home Financials are based on the most recent Mortgage that was taken out on this home.
Original Mortgage
$268,028
Interest Rate
4.4%
Mortgage Type
FHA
Purchase Details
Closed on
Sep 30, 2005
Sold by
Melody Homes Inc
Bought by
Closser J D and Closer Holley C
Home Financials for this Owner
Home Financials are based on the most recent Mortgage that was taken out on this home.
Original Mortgage
$266,660
Interest Rate
5.87%
Mortgage Type
Fannie Mae Freddie Mac
Create a Home Valuation Report for This Property
The Home Valuation Report is an in-depth analysis detailing your home's value as well as a comparison with similar homes in the area
Purchase History
| Date | Buyer | Sale Price | Title Company |
|---|---|---|---|
| Gomez Gregory Aaron | $573,000 | Land Title Guarantee | |
| Ortega Samuel J | $275,000 | Ct | |
| Closser J D | $333,325 | Land Title |
Source: Public Records
Mortgage History
| Date | Status | Borrower | Loan Amount |
|---|---|---|---|
| Open | Gomez Gregory Aaron | $509,000 | |
| Previous Owner | Ortega Samuel J | $268,028 | |
| Previous Owner | Closser J D | $266,660 |
Source: Public Records
Tax History
| Year | Tax Paid | Tax Assessment Tax Assessment Total Assessment is a certain percentage of the fair market value that is determined by local assessors to be the total taxable value of land and additions on the property. | Land | Improvement |
|---|---|---|---|---|
| 2025 | $5,027 | $53,310 | $8,910 | $44,400 |
| 2024 | $5,027 | $49,000 | $8,190 | $40,810 |
| 2023 | $5,002 | $55,270 | $7,440 | $47,830 |
| 2022 | $3,715 | $37,880 | $7,300 | $30,580 |
| 2021 | $3,579 | $37,880 | $7,300 | $30,580 |
| 2020 | $3,285 | $36,290 | $7,870 | $28,420 |
| 2019 | $3,288 | $36,290 | $7,870 | $28,420 |
| 2018 | $3,040 | $33,530 | $6,840 | $26,690 |
| 2017 | $3,035 | $33,530 | $6,840 | $26,690 |
| 2016 | $2,758 | $30,350 | $4,940 | $25,410 |
| 2015 | $2,751 | $30,350 | $4,940 | $25,410 |
| 2014 | $2,392 | $26,800 | $4,220 | $22,580 |
Source: Public Records
Map
Nearby Homes
- 13336 Olive St
- 13380 Oneida St
- 6883 E 132nd Place
- 12901 Spruce St
- 12891 Spruce St
- 13022 Tamarac Place
- 13455 Magnolia Ct
- 12814 Newport Way
- 8194 E 132nd Place
- 13200 Uinta St
- 8222 E 129th Place
- 8055 E 128th Place
- 13407 Valentia St
- 13190 Kearney St
- 12754 Leyden St Unit E
- 7875 E 136th Dr
- 12735 Ulster St
- 12729 Ulster St
- 12774 Leyden St Unit D
- 12822 Jasmine St Unit E
- 7154 E 132nd Ave
- 7193 E 131st Place
- 7228 E 132nd Ave
- 7185 E 131st Place
- 7108 E 132nd Ave
- 7205 E 131st Place
- 7264 E 132nd Ave
- 7167 E 131st Place
- 7273 E 131st Place
- 13250 Olive Way
- 7056 E 132nd Ave
- 7294 E 132nd Ave
- 7115 E 131st Place
- 7202 E 131st Place
- 7252 E 133rd Cir
- 7182 E 131st Place
- 7006 E 132nd Ave
- 7230 E 131st Place
- 7232 E 133rd Cir
- 7285 E 131st Place
Your Personal Tour Guide
Ask me questions while you tour the home.