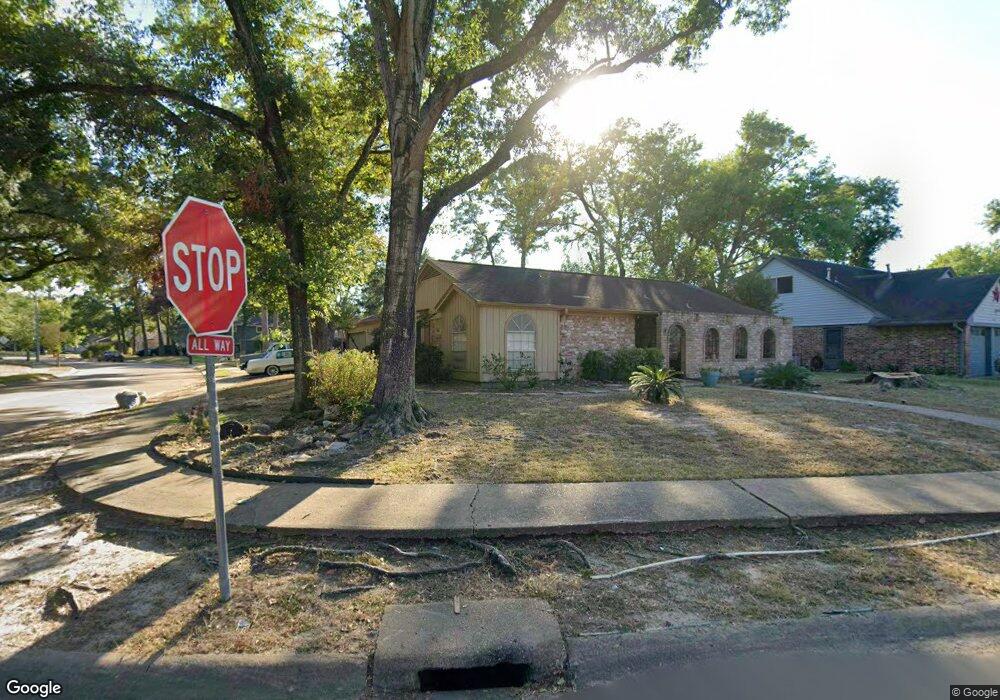
7203 Shady Corners Ln Houston, TX 77040
Greater Inwood NeighborhoodEstimated Value: $238,000 - $270,000
3
Beds
2
Baths
2,205
Sq Ft
$117/Sq Ft
Est. Value
About This Home
This home is located at 7203 Shady Corners Ln, Houston, TX 77040 and is currently estimated at $258,146, approximately $117 per square foot. 7203 Shady Corners Ln is a home located in Harris County with nearby schools including Holbrook Elementary School, Dean Middle School, and Jersey Village High School.
Ownership History
Date
Name
Owned For
Owner Type
Purchase Details
Closed on
Feb 9, 2009
Sold by
Bernal Alexander and Gorski Doris
Bought by
Joyce Thomas B
Current Estimated Value
Home Financials for this Owner
Home Financials are based on the most recent Mortgage that was taken out on this home.
Original Mortgage
$108,007
Outstanding Balance
$68,127
Interest Rate
5.06%
Mortgage Type
FHA
Estimated Equity
$190,019
Purchase Details
Closed on
Mar 29, 2002
Sold by
Giering Investments Lp
Bought by
Bernal Alexander and Gorski Doris
Home Financials for this Owner
Home Financials are based on the most recent Mortgage that was taken out on this home.
Original Mortgage
$108,145
Interest Rate
6.78%
Mortgage Type
FHA
Purchase Details
Closed on
Dec 19, 2001
Sold by
Craig Darrell and Craig Mary Ann
Bought by
Giering Investments Lp
Home Financials for this Owner
Home Financials are based on the most recent Mortgage that was taken out on this home.
Original Mortgage
$65,000
Interest Rate
6.39%
Create a Home Valuation Report for This Property
The Home Valuation Report is an in-depth analysis detailing your home's value as well as a comparison with similar homes in the area
Home Values in the Area
Average Home Value in this Area
Purchase History
| Date | Buyer | Sale Price | Title Company |
|---|---|---|---|
| Joyce Thomas B | -- | Vanguard Title | |
| Bernal Alexander | -- | Stewart Title | |
| Giering Investments Lp | -- | Stewart Title |
Source: Public Records
Mortgage History
| Date | Status | Borrower | Loan Amount |
|---|---|---|---|
| Open | Joyce Thomas B | $108,007 | |
| Previous Owner | Bernal Alexander | $108,145 | |
| Previous Owner | Giering Investments Lp | $65,000 |
Source: Public Records
Tax History Compared to Growth
Tax History
| Year | Tax Paid | Tax Assessment Tax Assessment Total Assessment is a certain percentage of the fair market value that is determined by local assessors to be the total taxable value of land and additions on the property. | Land | Improvement |
|---|---|---|---|---|
| 2025 | $3,082 | $226,959 | $60,724 | $166,235 |
| 2024 | $3,082 | $238,935 | $60,724 | $178,211 |
| 2023 | $3,082 | $240,307 | $60,724 | $179,583 |
| 2022 | $4,552 | $212,408 | $50,711 | $161,697 |
| 2021 | $4,326 | $167,417 | $50,711 | $116,706 |
| 2020 | $4,327 | $168,690 | $31,815 | $136,875 |
| 2019 | $4,095 | $147,762 | $19,089 | $128,673 |
| 2018 | $773 | $98,345 | $19,089 | $79,256 |
| 2017 | $2,966 | $107,114 | $19,089 | $88,025 |
| 2016 | $3,681 | $138,586 | $19,089 | $119,497 |
| 2015 | $2,276 | $131,654 | $15,908 | $115,746 |
| 2014 | $2,276 | $109,856 | $15,908 | $93,948 |
Source: Public Records
Map
Nearby Homes
- 9350 Guywood St
- 7318 Shady Grove Ln
- 7259 Shady Arbor Ln
- 9331 Deanwood St
- 7218 Stonegate Dr
- 9523 Vanwood St
- 7051 Majestic Oaks Dr
- 8615 Black Tern Ln
- 7718 Breezeway St
- 6902 Anson Point Ln
- 8610 Twillingate Ln
- 6407 Deirdre Anne Dr
- 9207 Loren Ln
- 7706 Deadwood Dr
- 7731 Deadwood Dr
- 6310 Silver Chalice Dr
- 9515 Summer Laurel Ln
- 9519 Summer Laurel Ln
- 6430 Pirtlewood Cir
- 9214 Woodland Oaks Dr
- 7207 Shady Corners Ln
- 9243 Landwood Dr
- 7211 Shady Corners Ln
- 9242 Landwood Dr
- 9239 Landwood Dr
- 9246 Landwood Dr
- 7206 Shady Corners Ln
- 7202 Shady Corners Ln
- 9238 Landwood Dr
- 7235 Shady Corners Ln
- 7239 Shady Corners Ln
- 7119 Woodland Trails Dr
- 7231 Shady Corners Ln
- 7210 Shady Corners Ln
- 9231 Landwood Dr
- 7243 Shady Corners Ln
- 7138 Shady Moss Ln
- 7115 Woodland Trails Dr
- 7142 Shady Moss Ln
- 7134 Shady Moss Ln