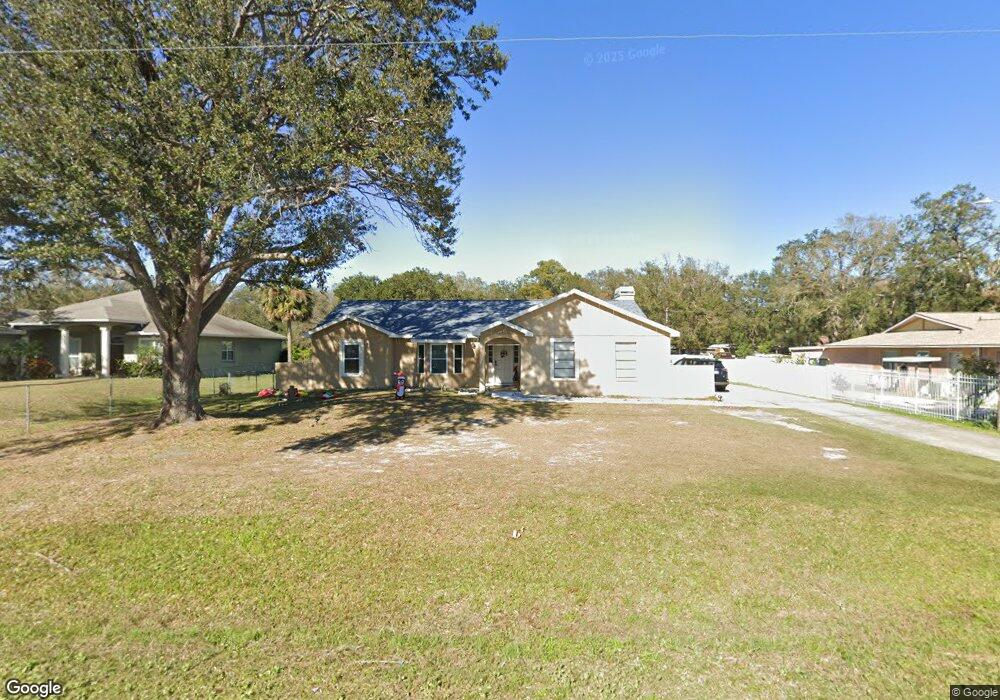
7204 36th Ave S Tampa, FL 33619
Great Palm River Point NeighborhoodEstimated Value: $439,000 - $573,000
3
Beds
2
Baths
2,677
Sq Ft
$184/Sq Ft
Est. Value
About This Home
This home is located at 7204 36th Ave S, Tampa, FL 33619 and is currently estimated at $491,348, approximately $183 per square foot. 7204 36th Ave S is a home located in Hillsborough County with nearby schools including Bing Elementary School, Giunta Middle School, and Spoto High School.
Ownership History
Date
Name
Owned For
Owner Type
Purchase Details
Closed on
Aug 1, 2016
Bought by
Coto Elder M Arias
Current Estimated Value
Home Financials for this Owner
Home Financials are based on the most recent Mortgage that was taken out on this home.
Original Mortgage
$213,750
Outstanding Balance
$170,548
Interest Rate
3.48%
Mortgage Type
New Conventional
Estimated Equity
$320,800
Purchase Details
Closed on
Jan 29, 2016
Sold by
Fha Attorney Services Llc
Bought by
Ramos & Ramos Investments Group Llc
Purchase Details
Closed on
Sep 9, 2015
Sold by
Safont Digna L
Bought by
Fha Attorney Services Llc
Purchase Details
Closed on
Feb 11, 2013
Sold by
Marino Geraldine N
Bought by
Safont Roger
Purchase Details
Closed on
Jul 31, 2009
Sold by
Safont Digna L and Marino Geraldine N
Bought by
Safont Roger and Safont Digna L
Purchase Details
Closed on
Aug 22, 2007
Sold by
Safont Digna L
Bought by
Safont Digna L
Create a Home Valuation Report for This Property
The Home Valuation Report is an in-depth analysis detailing your home's value as well as a comparison with similar homes in the area
Home Values in the Area
Average Home Value in this Area
Purchase History
| Date | Buyer | Sale Price | Title Company |
|---|---|---|---|
| Coto Elder M Arias | $225,000 | -- | |
| Ramos & Ramos Investments Group Llc | $135,000 | Peer Title Inc | |
| Fha Attorney Services Llc | $88,300 | Attorney | |
| Safont Roger | -- | Attorney | |
| Safont Roger | -- | Attorney | |
| Safont Digna L | -- | None Available |
Source: Public Records
Mortgage History
| Date | Status | Borrower | Loan Amount |
|---|---|---|---|
| Open | Coto Elder M Arias | $213,750 |
Source: Public Records
Tax History Compared to Growth
Tax History
| Year | Tax Paid | Tax Assessment Tax Assessment Total Assessment is a certain percentage of the fair market value that is determined by local assessors to be the total taxable value of land and additions on the property. | Land | Improvement |
|---|---|---|---|---|
| 2024 | $4,229 | $253,623 | -- | -- |
| 2023 | $4,072 | $246,236 | $0 | $0 |
| 2022 | $3,881 | $239,064 | $0 | $0 |
| 2021 | $3,836 | $232,101 | $0 | $0 |
| 2020 | $3,633 | $222,820 | $0 | $0 |
| 2019 | $3,522 | $217,810 | $0 | $0 |
| 2018 | $3,466 | $213,749 | $0 | $0 |
| 2017 | $3,471 | $212,194 | $0 | $0 |
| 2016 | $2,855 | $137,860 | $0 | $0 |
| 2015 | $2,257 | $102,995 | $0 | $0 |
| 2014 | $2,201 | $98,767 | $0 | $0 |
| 2013 | -- | $89,788 | $0 | $0 |
Source: Public Records
Map
Nearby Homes
- 3709 Daisy Bloom Place
- 3508 S 75th St
- 7412 Pearly Everlasting Ave
- 3802 Daisy Bloom Place
- 7614 35th Ave S
- 4009 Globe Thistle Dr
- 7170 Samuel Ivy Dr
- 7423 French Marigold Ave
- 4550 Globe Thistle Dr
- 7620 32nd Ave S
- 4527 Globe Thistle Dr
- 4448 Globe Thistle Dr
- 7128 Samuel Ivy Dr
- 7205 Ronnie Gardens Ct
- 4435 Globe Thistle Dr
- 7033 Samuel Ivy Dr
- 3220 Lancaster Ln
- 4311 Romano Busciglio St
- 4410 Summer Savory St
- 8436 Canterbury Lake Blvd
- 7112 36th Ave S
- 7110 36th Ave S
- 3415 S 73rd St
- 3407 S 74th St
- 7304 36th Ave S
- 3612 Cat Mint St
- 3608 Cat Mint St
- 3614 Cat Mint St
- 3606 Cat Mint St
- 7108 36th Ave S
- 3616 Cat Mint St
- 3604 Cat Mint St
- 3618 Cat Mint St
- 3602 Cat Mint St
- 3622 Cat Mint St
- 3624 Cat Mint St
- 3603 Romano Busciglio St
- 3611 Cat Mint St
- 3613 Cat Mint St