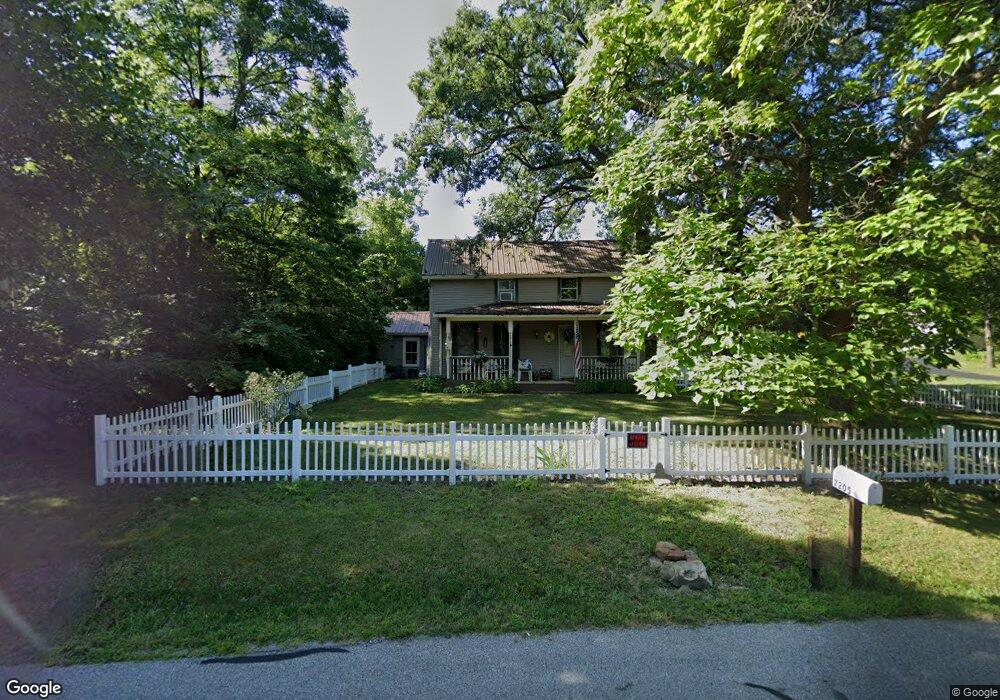
7205 Coonpath Rd Carroll, OH 43112
Bloom NeighborhoodEstimated Value: $282,000 - $365,000
3
Beds
1
Bath
1,432
Sq Ft
$214/Sq Ft
Est. Value
About This Home
This home is located at 7205 Coonpath Rd, Carroll, OH 43112 and is currently estimated at $306,925, approximately $214 per square foot. 7205 Coonpath Rd is a home located in Fairfield County with nearby schools including Bloom Carroll Primary School, Bloom Carroll Intermediate School, and Bloom-Carroll Middle School.
Ownership History
Date
Name
Owned For
Owner Type
Purchase Details
Closed on
Apr 15, 2020
Sold by
Barnhill Lolita F
Bought by
Barnhill Charlton A
Current Estimated Value
Home Financials for this Owner
Home Financials are based on the most recent Mortgage that was taken out on this home.
Original Mortgage
$46,000
Outstanding Balance
$40,231
Interest Rate
3.2%
Mortgage Type
New Conventional
Estimated Equity
$266,694
Purchase Details
Closed on
Aug 27, 2005
Sold by
Gueli John C
Bought by
Barnhill Charlton A and Barnhill Lolita F
Create a Home Valuation Report for This Property
The Home Valuation Report is an in-depth analysis detailing your home's value as well as a comparison with similar homes in the area
Home Values in the Area
Average Home Value in this Area
Purchase History
| Date | Buyer | Sale Price | Title Company |
|---|---|---|---|
| Barnhill Charlton A | -- | None Listed On Document | |
| Barnhill Charlton A | -- | -- |
Source: Public Records
Mortgage History
| Date | Status | Borrower | Loan Amount |
|---|---|---|---|
| Open | Barnhill Charlton A | $46,000 |
Source: Public Records
Tax History
| Year | Tax Paid | Tax Assessment Tax Assessment Total Assessment is a certain percentage of the fair market value that is determined by local assessors to be the total taxable value of land and additions on the property. | Land | Improvement |
|---|---|---|---|---|
| 2025 | $5,495 | $80,920 | $38,240 | $42,680 |
| 2024 | $5,495 | $66,690 | $24,060 | $42,630 |
| 2023 | $2,744 | $63,320 | $24,060 | $39,260 |
| 2022 | $2,765 | $63,320 | $24,060 | $39,260 |
| 2021 | $2,239 | $46,370 | $19,250 | $27,120 |
| 2020 | $2,263 | $46,370 | $19,250 | $27,120 |
| 2019 | $2,270 | $46,370 | $19,250 | $27,120 |
| 2018 | $1,693 | $35,690 | $16,170 | $19,520 |
| 2017 | $1,597 | $34,920 | $15,400 | $19,520 |
| 2016 | $1,574 | $34,920 | $15,400 | $19,520 |
| 2015 | $1,538 | $33,160 | $15,400 | $17,760 |
| 2014 | $1,477 | $33,160 | $15,400 | $17,760 |
| 2013 | $1,477 | $33,160 | $15,400 | $17,760 |
Source: Public Records
Map
Nearby Homes
- 3510 Kauffman Rd NW
- 2115 Lamb Rd NW
- 7195 Alspach Rd NW
- 3540 Carroll-Southern Rd NW
- 8322 Benson Rd
- 2155 Carroll-Southern Rd NW
- 50 Market St
- 2291 Carroll-Southern Rd NW
- 52 W Canal St
- 5341 Carnes Rd NW
- 0 Sitterley Rd NW Unit 226004980
- 5840 High St NW
- 5699 Feldon Ct NW
- 7835 E Ohio State Ln NW
- 8158 Brittany Dr NW
- 5560 Amanda Northern Rd NW
- 6985 Royalton Rd SW
- 55 Betz Rd SW
- 6103 Pickerington Rd
- 5840 Amanda Northern Rd NW
- 7255 Coonpath Rd
- 7207 Coonpath Rd
- 7207 Coonpath Rd
- 7204 Coonpath Rd
- 7105 Coonpath Rd
- 7153 Coonpath Rd
- 7285 Coonpath Rd
- 7110 Coonpath Rd
- 7356 Coonpath Rd
- 7353 Coonpath Rd
- 7353 Coonpath Rd NW
- 7131 Coonpath Rd
- 7000 Coonpath Rd NW
- 7007 Coonpath Rd
- 3160 Pickerington Rd
- 7000 Coonpath Rd
- 2780 Pickerington Rd
- 6996 Coonpath Rd
- 6940 Coonpath Rd
- 7280 Woodale Dr
Your Personal Tour Guide
Ask me questions while you tour the home.