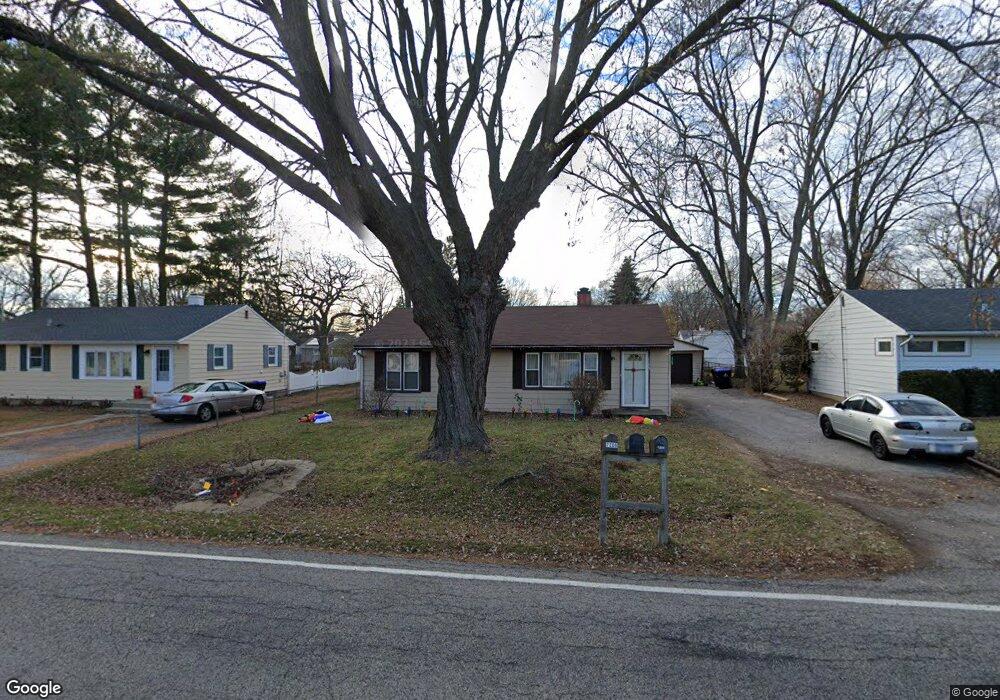
7205 Manor Rd Crystal Lake, IL 60014
Estimated Value: $200,000 - $275,000
--
Bed
--
Bath
960
Sq Ft
$246/Sq Ft
Est. Value
About This Home
This home is located at 7205 Manor Rd, Crystal Lake, IL 60014 and is currently estimated at $236,096, approximately $245 per square foot. 7205 Manor Rd is a home located in McHenry County with nearby schools including Canterbury Elementary School, Hannah Beardsley Middle School, and Crystal Lake Central High School.
Ownership History
Date
Name
Owned For
Owner Type
Purchase Details
Closed on
Nov 6, 2002
Sold by
Taj Mohammad Sadiq and Taj Shahida
Bought by
Lopez Ventura
Current Estimated Value
Home Financials for this Owner
Home Financials are based on the most recent Mortgage that was taken out on this home.
Original Mortgage
$114,000
Interest Rate
6.3%
Purchase Details
Closed on
Nov 2, 2002
Sold by
Shameem Ejaz
Bought by
Taj Mohammad S and Taj Shahida
Home Financials for this Owner
Home Financials are based on the most recent Mortgage that was taken out on this home.
Original Mortgage
$114,000
Interest Rate
6.3%
Purchase Details
Closed on
Sep 17, 1993
Sold by
Taj Mohammad S and Taj Shahida
Bought by
Taj Mohammad Sadiq and Taj Shahida
Home Financials for this Owner
Home Financials are based on the most recent Mortgage that was taken out on this home.
Original Mortgage
$68,000
Interest Rate
7.22%
Create a Home Valuation Report for This Property
The Home Valuation Report is an in-depth analysis detailing your home's value as well as a comparison with similar homes in the area
Home Values in the Area
Average Home Value in this Area
Purchase History
| Date | Buyer | Sale Price | Title Company |
|---|---|---|---|
| Lopez Ventura | $120,000 | Multiple | |
| Taj Mohammad S | -- | Multiple | |
| Taj Mohammad Sadiq | -- | Universal Title Services Inc |
Source: Public Records
Mortgage History
| Date | Status | Borrower | Loan Amount |
|---|---|---|---|
| Previous Owner | Lopez Ventura | $114,000 | |
| Previous Owner | Taj Mohammad Sadiq | $68,000 |
Source: Public Records
Tax History Compared to Growth
Tax History
| Year | Tax Paid | Tax Assessment Tax Assessment Total Assessment is a certain percentage of the fair market value that is determined by local assessors to be the total taxable value of land and additions on the property. | Land | Improvement |
|---|---|---|---|---|
| 2024 | $3,758 | $57,026 | $14,203 | $42,823 |
| 2023 | $3,583 | $51,003 | $12,703 | $38,300 |
| 2022 | $2,876 | $39,732 | $13,930 | $25,802 |
| 2021 | $2,688 | $37,015 | $12,977 | $24,038 |
| 2020 | $2,619 | $35,705 | $12,518 | $23,187 |
| 2019 | $2,525 | $34,174 | $11,981 | $22,193 |
| 2018 | $2,342 | $31,570 | $11,068 | $20,502 |
| 2017 | $2,302 | $29,741 | $10,427 | $19,314 |
| 2016 | $2,227 | $27,895 | $9,780 | $18,115 |
| 2013 | $1,499 | $35,656 | $9,124 | $26,532 |
Source: Public Records
Map
Nearby Homes
- 674 Pointe Dr Unit 123
- +/-5.72 Acres S Illinois Route 31
- 4717 Wallens Dr
- 800 Oakbrook Dr
- 602 Hillcrest Ln
- 822 Oakbrook Dr
- 903 Crookedstick Ct
- 923 Crookedstick Ct
- 265 Forestview Dr
- 0 Arthur Lot 27 St Unit MRD12290210
- 0 Arthur Lot 32 St Unit MRD12290256
- 0 Arthur Lot 026 St Unit MRD12290197
- 000 SE Route 31 & River Birch SE
- 0 Arthur Lot 022 St Unit MRD12289886
- 0 Arthur Lot 023 St Unit MRD12289968
- 0 Arthur Lot 28 St Unit MRD12290223
- 0 Arthur Lot 33 St Unit MRD12290266
- 393 & 395 S Oriole Trail
- Lot 1 Virginia St
- 2020 W Rt 176