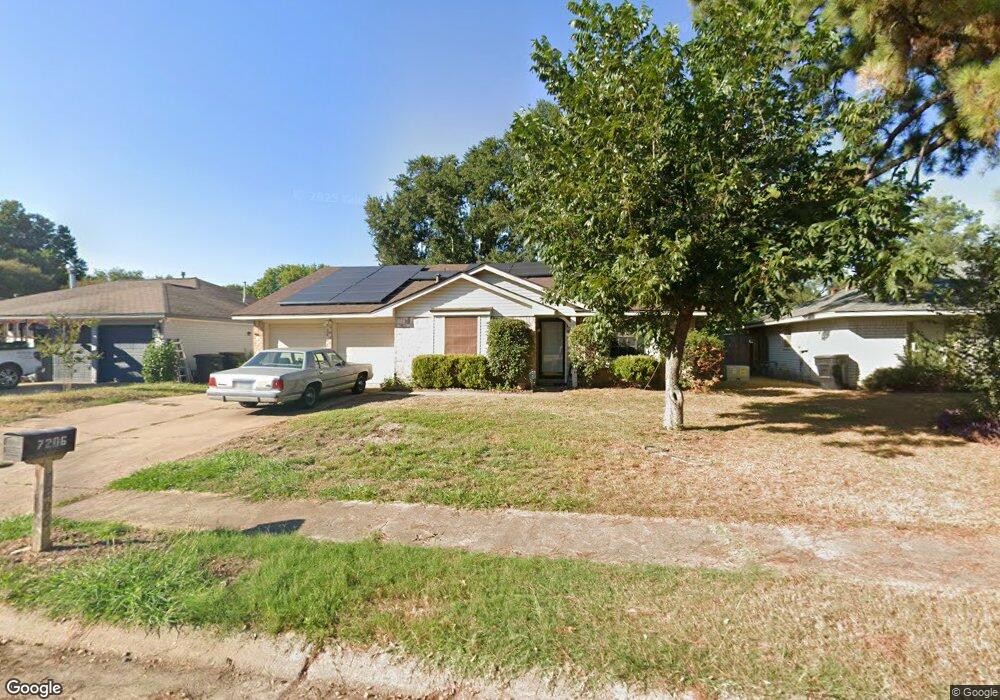
7206 Brook Stone Dr Houston, TX 77040
Greater Inwood NeighborhoodEstimated Value: $218,568 - $238,000
3
Beds
2
Baths
1,522
Sq Ft
$153/Sq Ft
Est. Value
About This Home
This home is located at 7206 Brook Stone Dr, Houston, TX 77040 and is currently estimated at $232,142, approximately $152 per square foot. 7206 Brook Stone Dr is a home located in Harris County with nearby schools including Holbrook Elementary School, Dean Middle School, and Jersey Village High School.
Ownership History
Date
Name
Owned For
Owner Type
Purchase Details
Closed on
Oct 13, 2024
Sold by
White John Stone and White John S
Bought by
John Stone White Living Trust and White
Current Estimated Value
Purchase Details
Closed on
Aug 26, 2008
Sold by
Parish Cordelia Cummins and Parish Delia
Bought by
White John S
Purchase Details
Closed on
Feb 26, 2007
Sold by
Parish Cordelia Cummins and Parish Delia
Bought by
White John S
Purchase Details
Closed on
Feb 1, 2006
Sold by
White John S
Bought by
Parish Cordelia Cummins and Parish Delia
Purchase Details
Closed on
May 29, 2001
Sold by
Thompson Stanley B and Thompson Vicky L
Bought by
Parish Delia
Home Financials for this Owner
Home Financials are based on the most recent Mortgage that was taken out on this home.
Original Mortgage
$95,148
Interest Rate
7.07%
Mortgage Type
FHA
Create a Home Valuation Report for This Property
The Home Valuation Report is an in-depth analysis detailing your home's value as well as a comparison with similar homes in the area
Home Values in the Area
Average Home Value in this Area
Purchase History
| Date | Buyer | Sale Price | Title Company |
|---|---|---|---|
| John Stone White Living Trust | -- | None Listed On Document | |
| White John S | -- | Sendera Title | |
| White John S | -- | None Available | |
| Parish Cordelia Cummins | -- | None Available | |
| Parish Delia | -- | American Title Co |
Source: Public Records
Mortgage History
| Date | Status | Borrower | Loan Amount |
|---|---|---|---|
| Previous Owner | Parish Delia | $95,148 | |
| Closed | Parish Cordelia Cummins | $0 |
Source: Public Records
Tax History Compared to Growth
Tax History
| Year | Tax Paid | Tax Assessment Tax Assessment Total Assessment is a certain percentage of the fair market value that is determined by local assessors to be the total taxable value of land and additions on the property. | Land | Improvement |
|---|---|---|---|---|
| 2025 | $68 | $214,815 | $60,348 | $154,467 |
| 2024 | $68 | $222,299 | $60,348 | $161,951 |
| 2023 | $68 | $205,903 | $60,348 | $145,555 |
| 2022 | $3,886 | $181,692 | $50,397 | $131,295 |
| 2021 | $3,694 | $142,939 | $50,397 | $92,542 |
| 2020 | $3,818 | $154,990 | $35,640 | $119,350 |
| 2019 | $3,613 | $133,834 | $21,384 | $112,450 |
| 2018 | $1,005 | $118,513 | $21,384 | $97,129 |
| 2017 | $3,282 | $118,513 | $21,384 | $97,129 |
| 2016 | $3,203 | $118,513 | $21,384 | $97,129 |
| 2015 | $1,952 | $111,875 | $17,820 | $94,055 |
| 2014 | $1,952 | $95,571 | $17,820 | $77,751 |
Source: Public Records
Map
Nearby Homes
- 7218 Stonegate Dr
- 7259 Shady Arbor Ln
- 8615 Black Tern Ln
- 7318 Shady Grove Ln
- 6902 Anson Point Ln
- 8610 Twillingate Ln
- 9350 Guywood St
- 9331 Deanwood St
- 6407 Deirdre Anne Dr
- 7718 Breezeway St
- 6310 Silver Chalice Dr
- 9207 Loren Ln
- 9523 Vanwood St
- 6338 Maple Hill Dr
- 7051 Majestic Oaks Dr
- 8007 E Oakwood Ct
- 9214 Woodland Oaks Dr
- 6430 Pirtlewood Cir
- 8020 Oakwood Forest Dr
- 7218 Jadewood Dr Unit 770
- 7206 W Brookstone
- 7202 Brook Stone Dr
- 7210 Brook Stone Dr
- 7211 Stonegate Dr
- 7214 Brook Stone Dr
- 7207 Stonegate Dr
- 7215 Stonegate Dr
- 7219 Stonegate Dr
- 7207 Brook Stone Dr
- 7211 Brook Stone Dr
- 7218 Brook Stone Dr
- 7203 Brook Stone Dr
- 7138 Brook Stone Dr
- 7215 Brook Stone Dr
- 7143 Brook Stone Dr
- 8802 Arbor Wood Dr
- 3406-3412 Brook Stone Dr
- 3406-3419 Brook Stone Dr
- 7219 Brook Stone Dr
- 7222 Brook Stone Dr