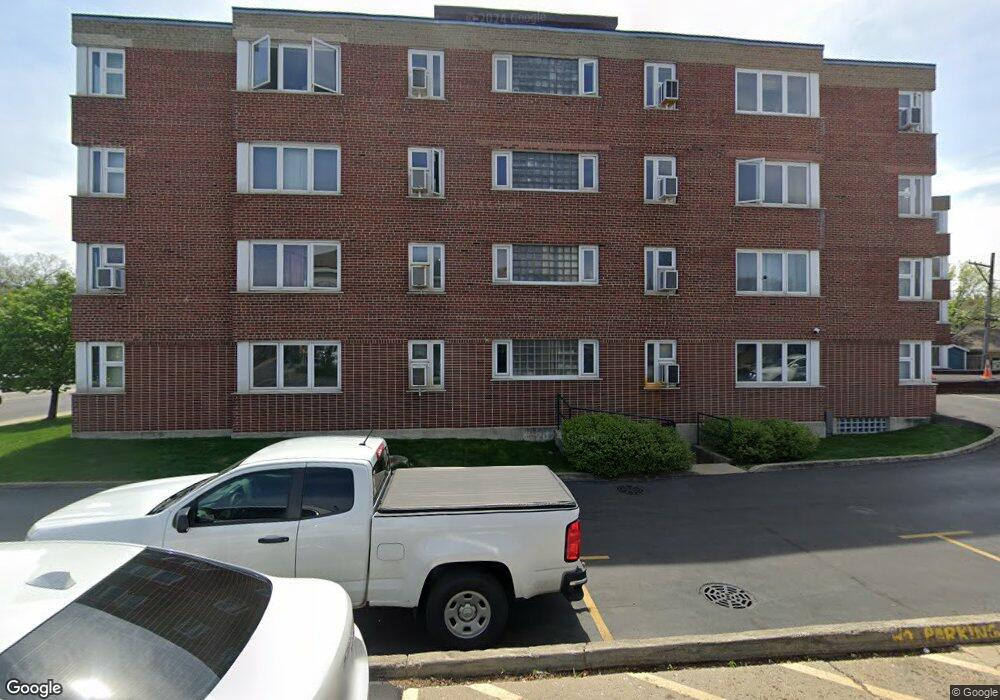
River Forest Garden Condominium 7206 Oak Ave Unit 72061N River Forest, IL 60305
Estimated Value: $102,000 - $125,000
1
Bed
1
Bath
764
Sq Ft
$148/Sq Ft
Est. Value
About This Home
This home is located at 7206 Oak Ave Unit 72061N, River Forest, IL 60305 and is currently estimated at $112,843, approximately $147 per square foot. 7206 Oak Ave Unit 72061N is a home located in Cook County with nearby schools including Roosevelt Middle School, Lincoln Elementary School, and Oak Park and River Forest High School.
Ownership History
Date
Name
Owned For
Owner Type
Purchase Details
Closed on
May 17, 2021
Sold by
Howard John and Howard Margaret
Bought by
Thomas Kelly
Current Estimated Value
Home Financials for this Owner
Home Financials are based on the most recent Mortgage that was taken out on this home.
Original Mortgage
$37,500
Outstanding Balance
$33,931
Interest Rate
3%
Mortgage Type
New Conventional
Estimated Equity
$78,912
Purchase Details
Closed on
Apr 3, 2019
Sold by
Drake Maria
Bought by
Howard John and Howard Margaret
Purchase Details
Closed on
Feb 16, 2017
Sold by
Johnson Marjorie C and Cook Patricia C
Bought by
Drake Maria
Purchase Details
Closed on
Apr 22, 2015
Sold by
Cronin Michael G
Bought by
Cronin Michael G and Michael G Cronin Revocable Trust
Purchase Details
Closed on
May 19, 1999
Sold by
Dupage National Bank
Bought by
Gronin Michael G
Create a Home Valuation Report for This Property
The Home Valuation Report is an in-depth analysis detailing your home's value as well as a comparison with similar homes in the area
Home Values in the Area
Average Home Value in this Area
Purchase History
| Date | Buyer | Sale Price | Title Company |
|---|---|---|---|
| Thomas Kelly | $72,500 | Chicago Title Insurance Co | |
| Howard John | $56,000 | Chicago Title | |
| Drake Maria | $58,500 | Attorney | |
| Cronin Michael G | -- | Attorneys Title Guaranty Fun | |
| Gronin Michael G | -- | -- |
Source: Public Records
Mortgage History
| Date | Status | Borrower | Loan Amount |
|---|---|---|---|
| Open | Thomas Kelly | $37,500 |
Source: Public Records
Tax History Compared to Growth
Tax History
| Year | Tax Paid | Tax Assessment Tax Assessment Total Assessment is a certain percentage of the fair market value that is determined by local assessors to be the total taxable value of land and additions on the property. | Land | Improvement |
|---|---|---|---|---|
| 2024 | $2,252 | $8,228 | $1,004 | $7,224 |
| 2023 | $1,737 | $8,228 | $1,004 | $7,224 |
| 2022 | $1,737 | $5,380 | $1,062 | $4,318 |
| 2021 | $637 | $5,379 | $1,062 | $4,317 |
| 2020 | $692 | $5,379 | $1,062 | $4,317 |
| 2019 | $1,702 | $5,483 | $965 | $4,518 |
| 2018 | $2,131 | $7,251 | $965 | $6,286 |
| 2017 | $1,135 | $7,251 | $965 | $6,286 |
| 2016 | $561 | $4,242 | $811 | $3,431 |
| 2015 | $512 | $4,242 | $811 | $3,431 |
| 2014 | $484 | $4,242 | $811 | $3,431 |
| 2013 | -- | $4,971 | $811 | $4,160 |
Source: Public Records
About River Forest Garden Condominium
Map
Nearby Homes
- 7206 Oak Ave Unit 4SE
- 7200 Oak Ave Unit 4SW
- 7200 Oak Ave Unit 3NW
- 7210 Oak Ave Unit 4SW
- 7210 Oak Ave Unit 3SW
- 734 Bonnie Brae Place
- 1038 Superior St Unit 1W
- 420 N Marion St
- 1124 Lake St Unit 511
- 7346 Lake St Unit 2W
- 435 William St Unit 607
- 203 N Kenilworth Ave Unit 2N
- 203 N Kenilworth Ave Unit 2P
- 221 N Kenilworth Ave Unit 105
- 547 Jackson Ave
- 224 N Kenilworth Ave Unit 4D
- 823 Jackson Ave
- 35 Elgin Ave Unit A
- 222 N Grove Ave Unit 2B
- 742 N Marion St
- 7206 Oak Ave Unit 72062S
- 7206 Oak Ave Unit 72064S
- 7206 Oak Ave Unit 72063S
- 7206 Oak Ave Unit 72064N
- 7206 Oak Ave Unit 72063N
- 7206 Oak Ave Unit 72061S
- 7206 Oak Ave Unit 72064S
- 7206 Oak Ave Unit 72063S
- 7206 Oak Ave Unit 72063N
- 7206 Oak Ave Unit 72062S
- 7206 Oak Ave Unit 72062N
- 7206 Oak Ave Unit 72064N
- 7206 Oak Ave Unit 72062N
- 7206 Oak Ave Unit 1NE
- 7206 Oak Ave Unit 3SW
- 7206 Oak Ave Unit 2NW
- 7206 Oak Ave Unit 2SW
- 7206 Oak Ave Unit 1SE
- 7206 Oak Ave Unit 1NW
- 7206 Oak Ave Unit 3NE