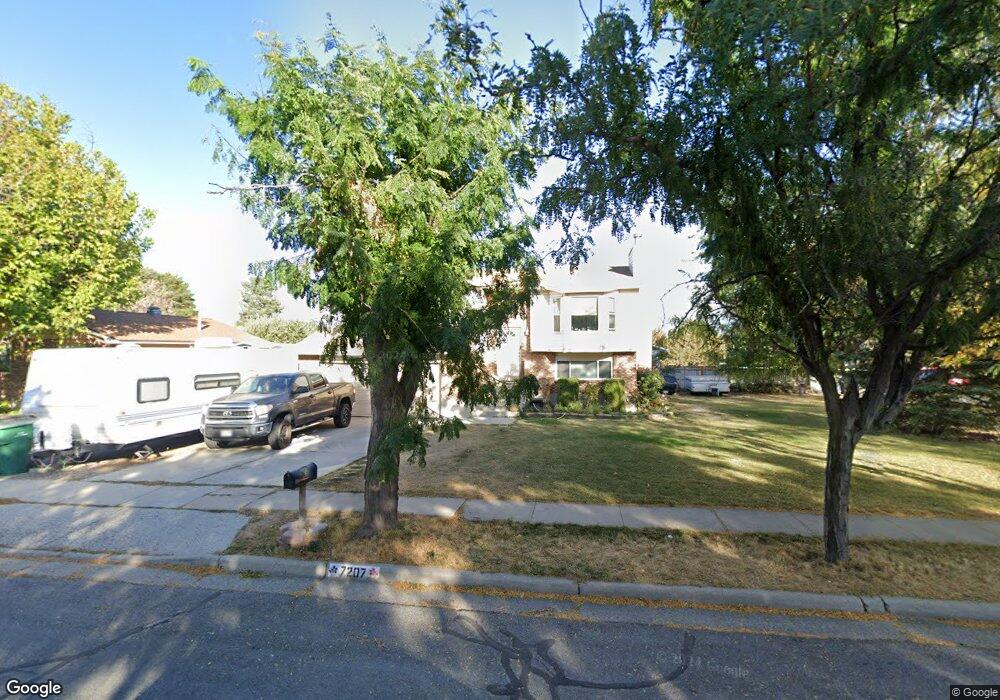
7207 Woodgreen Rd West Jordan, UT 84084
Estimated Value: $492,000 - $551,000
4
Beds
2
Baths
1,128
Sq Ft
$460/Sq Ft
Est. Value
About This Home
This home is located at 7207 Woodgreen Rd, West Jordan, UT 84084 and is currently estimated at $519,077, approximately $460 per square foot. 7207 Woodgreen Rd is a home located in Salt Lake County with nearby schools including Oquirrh Elementary School, Joel P. Jensen Middle School, and West Jordan High School.
Ownership History
Date
Name
Owned For
Owner Type
Purchase Details
Closed on
Jun 15, 2010
Sold by
Glines Eric R
Bought by
Moeung Paula Nguy
Current Estimated Value
Home Financials for this Owner
Home Financials are based on the most recent Mortgage that was taken out on this home.
Original Mortgage
$193,344
Outstanding Balance
$132,902
Interest Rate
5.5%
Mortgage Type
FHA
Estimated Equity
$386,175
Purchase Details
Closed on
Apr 19, 2006
Sold by
Glines Robert L and Glines Lisa
Bought by
Glines Eric R
Home Financials for this Owner
Home Financials are based on the most recent Mortgage that was taken out on this home.
Original Mortgage
$40,500
Interest Rate
6.35%
Mortgage Type
Stand Alone Second
Purchase Details
Closed on
May 27, 2004
Sold by
Hawker Kendall and Hawker Jan
Bought by
Glines Robert L and Glines Lisa
Purchase Details
Closed on
Mar 30, 2004
Sold by
Penn Gregory A and Penn Christine E
Bought by
Hawker Kendall and Hawker Jan
Create a Home Valuation Report for This Property
The Home Valuation Report is an in-depth analysis detailing your home's value as well as a comparison with similar homes in the area
Home Values in the Area
Average Home Value in this Area
Purchase History
| Date | Buyer | Sale Price | Title Company |
|---|---|---|---|
| Moeung Paula Nguy | -- | Metro National Title | |
| Glines Eric R | -- | Canyon View Title Ins Agency | |
| Glines Robert L | -- | Merrill Title | |
| Hawker Kendall | $78,598 | First Southwestern Title |
Source: Public Records
Mortgage History
| Date | Status | Borrower | Loan Amount |
|---|---|---|---|
| Open | Moeung Paula Nguy | $193,344 | |
| Previous Owner | Glines Eric R | $40,500 | |
| Previous Owner | Glines Eric R | $121,500 |
Source: Public Records
Tax History Compared to Growth
Tax History
| Year | Tax Paid | Tax Assessment Tax Assessment Total Assessment is a certain percentage of the fair market value that is determined by local assessors to be the total taxable value of land and additions on the property. | Land | Improvement |
|---|---|---|---|---|
| 2025 | $2,233 | $448,700 | $171,000 | $277,700 |
| 2024 | $2,233 | $429,700 | $163,800 | $265,900 |
| 2023 | $2,252 | $408,400 | $154,500 | $253,900 |
| 2022 | $2,308 | $411,700 | $151,500 | $260,200 |
| 2021 | $1,953 | $317,100 | $116,200 | $200,900 |
| 2020 | $1,847 | $281,500 | $116,200 | $165,300 |
| 2019 | $1,849 | $276,400 | $90,900 | $185,500 |
| 2018 | $1,736 | $257,300 | $87,800 | $169,500 |
| 2017 | $1,491 | $220,000 | $87,800 | $132,200 |
| 2016 | $1,458 | $202,200 | $87,800 | $114,400 |
| 2015 | $1,451 | $196,100 | $87,000 | $109,100 |
| 2014 | $1,431 | $190,500 | $85,300 | $105,200 |
Source: Public Records
Map
Nearby Homes
- 7122 S Wood Green Rd
- 6980 S 3535 W Unit 2
- 6968 S 3535 W Unit 3
- 6894 S 3420 W
- 3383 W 6880 S
- 6992 W Terraine Rd
- 6978 W Terraine Rd
- 6863 S Dixie Dr
- 6893 S 3200 W
- 7611 S Springbrook Dr
- 3422 Briar Dr
- 8524 S Michele River Ave W Unit 109
- 7604 S Autumn Dr
- 3354 W 7800 S
- 6672 S 3335 W
- 2886 W 7550 S
- 6878 Claytonridge Way Unit C12
- 6788 Valence Ln
- 3165 W 7720 S
- 3629 W 7825 S
- 7207 S Woodgreen Rd
- 7191 Woodgreen Rd
- 3450 New World Dr
- 3467 New World Dr
- 3437 W Denton Cir
- 3437 Denton Cir
- 3467 W New World Dr
- 7208 Woodgreen Rd
- 7208 S Woodgreen Rd
- 7179 Woodgreen Rd
- 7194 S 3480 W
- 3449 New World Dr
- 3449 W New World Dr
- 7194 Woodgreen Rd
- 7194 S Woodgreen Rd
- 7208 Bromley Rd
- 3442 Denton Cir
- 3493 New World Dr
- 3493 W New World Dr
- 7182 S Woodgreen Rd