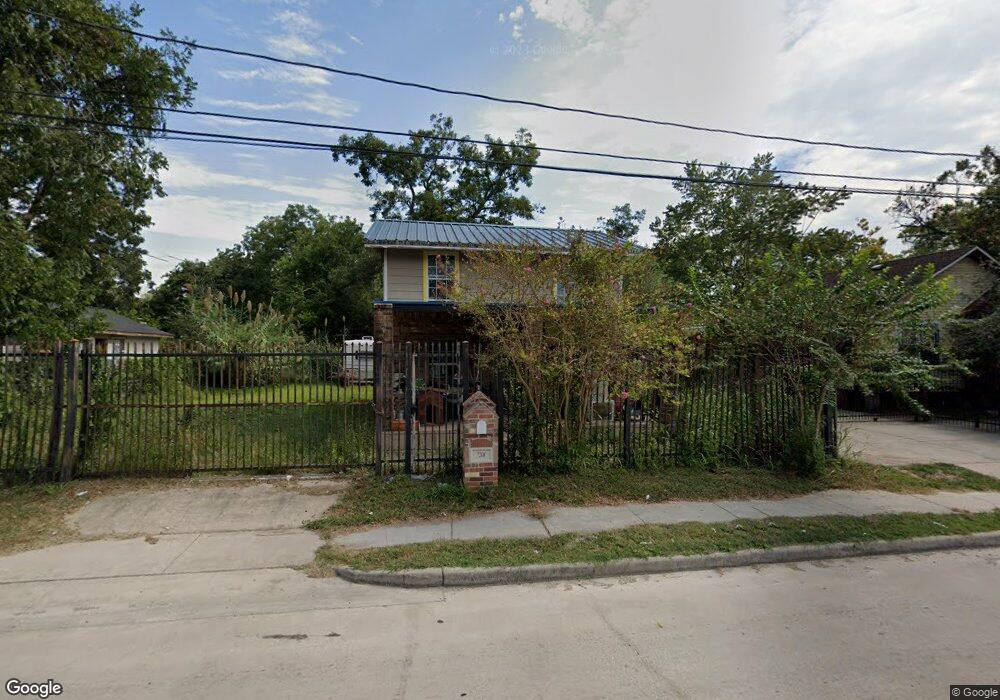
7208 Hirsch Rd Houston, TX 77016
Trinity-Houston Gardens NeighborhoodEstimated Value: $164,000 - $237,000
3
Beds
1
Bath
1,200
Sq Ft
$175/Sq Ft
Est. Value
About This Home
This home is located at 7208 Hirsch Rd, Houston, TX 77016 and is currently estimated at $210,199, approximately $175 per square foot. 7208 Hirsch Rd is a home located in Harris County with nearby schools including Roderick R. Paige Elementary School, Key Middle, and Kashmere High School.
Ownership History
Date
Name
Owned For
Owner Type
Purchase Details
Closed on
Jun 24, 2008
Sold by
Consumer Solutions Reo Llc
Bought by
Rodriguez Raziel M
Current Estimated Value
Purchase Details
Closed on
May 6, 2008
Sold by
Randle Lathsha
Bought by
Consumer Solutions Reo Llc
Purchase Details
Closed on
May 4, 2006
Sold by
Resby Rose Mary
Bought by
Randle Lathsha
Home Financials for this Owner
Home Financials are based on the most recent Mortgage that was taken out on this home.
Original Mortgage
$60,800
Interest Rate
9.35%
Mortgage Type
Fannie Mae Freddie Mac
Purchase Details
Closed on
Apr 25, 2006
Sold by
Hardy James and Peterson Minnie
Bought by
Resby Rose Mary
Home Financials for this Owner
Home Financials are based on the most recent Mortgage that was taken out on this home.
Original Mortgage
$60,800
Interest Rate
9.35%
Mortgage Type
Fannie Mae Freddie Mac
Create a Home Valuation Report for This Property
The Home Valuation Report is an in-depth analysis detailing your home's value as well as a comparison with similar homes in the area
Home Values in the Area
Average Home Value in this Area
Purchase History
| Date | Buyer | Sale Price | Title Company |
|---|---|---|---|
| Rodriguez Raziel M | -- | First American Title | |
| Consumer Solutions Reo Llc | $46,692 | None Available | |
| Randle Lathsha | -- | Startex Title Company | |
| Resby Rose Mary | -- | Startex 07 Title Company |
Source: Public Records
Mortgage History
| Date | Status | Borrower | Loan Amount |
|---|---|---|---|
| Previous Owner | Randle Lathsha | $60,800 |
Source: Public Records
Tax History Compared to Growth
Tax History
| Year | Tax Paid | Tax Assessment Tax Assessment Total Assessment is a certain percentage of the fair market value that is determined by local assessors to be the total taxable value of land and additions on the property. | Land | Improvement |
|---|---|---|---|---|
| 2025 | $5,124 | $222,439 | $74,143 | $148,296 |
| 2024 | $5,124 | $244,887 | $74,143 | $170,744 |
| 2023 | $5,124 | $209,769 | $66,115 | $143,654 |
| 2022 | $3,566 | $161,956 | $44,864 | $117,092 |
| 2021 | $2,372 | $101,762 | $35,419 | $66,343 |
| 2020 | $1,980 | $81,762 | $22,668 | $59,094 |
| 2019 | $1,774 | $70,105 | $18,890 | $51,215 |
| 2018 | $1,211 | $47,850 | $11,334 | $36,516 |
| 2017 | $1,210 | $47,850 | $11,334 | $36,516 |
| 2016 | $1,210 | $47,850 | $11,334 | $36,516 |
| 2015 | $784 | $41,473 | $8,973 | $32,500 |
| 2014 | $784 | $30,509 | $8,973 | $21,536 |
Source: Public Records
Map
Nearby Homes
- 7202 Los Angeles St
- 0 Glass St
- 7330 Glass St
- 4225 Denmark St
- 4126 Dorchester St
- 7511 Hirsch Rd
- 4322 Bennington St
- 4310 Bennington St
- 7508 Glass St
- 4419 Denmark St
- 4103 Lumber Ln
- 0 Bonita St Unit 45150086
- 3911 Dorchester St
- 6809 Glass St
- 4006 Yorkshire St
- 7006 Bonita St
- 6822 Bonita St
- 00 Bonita St
- 4009 Yorkshire St
- 3941 Lynnfield St
- 7212 Hirsch Rd
- 7204 Hirsch Rd
- 7201 Los Angeles St
- 7215 Los Angeles St
- 7119 Los Angeles St
- 7115 Los Angeles St
- 7205 Hirsch Rd
- 7217 Hirsch Rd
- 7125 Hirsch Rd
- 7221 Los Angeles St
- 7230 Hirsch Rd
- 7116 Hirsch
- 7221 Hirsch Rd
- 7301 Los Angeles St
- 7315 Los Angeles St
- 7117 Hirsch Rd
- 7302 Hirsch Rd
- 4118 Vance St
- 7310 Hirsch Rd
- 7102 Hirsch Rd