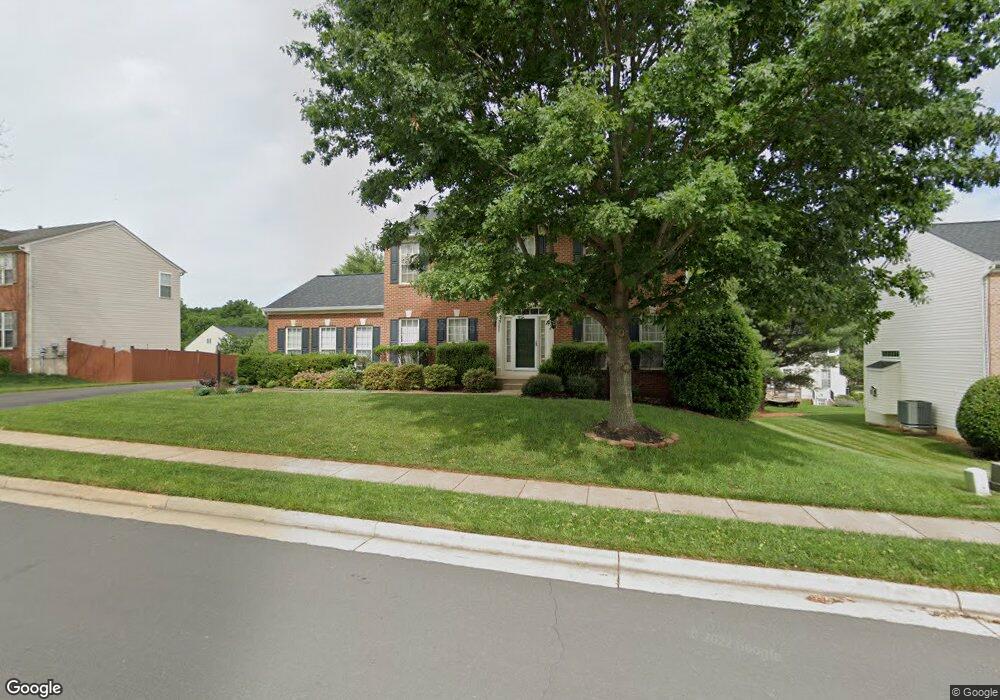
7209 Forkland Way Gainesville, VA 20155
Estimated Value: $780,000 - $839,000
4
Beds
3
Baths
2,704
Sq Ft
$295/Sq Ft
Est. Value
About This Home
This home is located at 7209 Forkland Way, Gainesville, VA 20155 and is currently estimated at $798,413, approximately $295 per square foot. 7209 Forkland Way is a home located in Prince William County with nearby schools including Buckland Mills Elementary School, Ronald Wilson Reagan Middle School, and St. Michael's Academy.
Ownership History
Date
Name
Owned For
Owner Type
Purchase Details
Closed on
Jul 17, 2008
Sold by
Hsbc Bank Usa Ntl Assoc T
Bought by
Chen Weiliang and Chen Xie,Fang
Current Estimated Value
Home Financials for this Owner
Home Financials are based on the most recent Mortgage that was taken out on this home.
Original Mortgage
$250,000
Outstanding Balance
$163,556
Interest Rate
6.35%
Mortgage Type
New Conventional
Estimated Equity
$634,857
Purchase Details
Closed on
Jan 16, 2007
Sold by
Kim Min Soo
Bought by
Lee Soo Juong
Home Financials for this Owner
Home Financials are based on the most recent Mortgage that was taken out on this home.
Original Mortgage
$478,400
Interest Rate
6.14%
Mortgage Type
New Conventional
Purchase Details
Closed on
Sep 24, 2003
Sold by
Nvr Inc
Bought by
Kim Min Soo
Home Financials for this Owner
Home Financials are based on the most recent Mortgage that was taken out on this home.
Original Mortgage
$272,500
Interest Rate
6.29%
Mortgage Type
New Conventional
Create a Home Valuation Report for This Property
The Home Valuation Report is an in-depth analysis detailing your home's value as well as a comparison with similar homes in the area
Home Values in the Area
Average Home Value in this Area
Purchase History
| Date | Buyer | Sale Price | Title Company |
|---|---|---|---|
| Chen Weiliang | $350,000 | -- | |
| Lee Soo Juong | $598,000 | -- | |
| Kim Min Soo | $363,460 | -- |
Source: Public Records
Mortgage History
| Date | Status | Borrower | Loan Amount |
|---|---|---|---|
| Open | Chen Weiliang | $250,000 | |
| Previous Owner | Lee Soo Juong | $478,400 | |
| Previous Owner | Kim Min Soo | $272,500 |
Source: Public Records
Tax History Compared to Growth
Tax History
| Year | Tax Paid | Tax Assessment Tax Assessment Total Assessment is a certain percentage of the fair market value that is determined by local assessors to be the total taxable value of land and additions on the property. | Land | Improvement |
|---|---|---|---|---|
| 2025 | $6,514 | $725,300 | $248,800 | $476,500 |
| 2024 | $6,514 | $655,000 | $222,000 | $433,000 |
| 2023 | $6,510 | $625,700 | $207,600 | $418,100 |
| 2022 | $6,433 | $580,900 | $172,900 | $408,000 |
| 2021 | $6,193 | $508,000 | $147,900 | $360,100 |
| 2020 | $6,980 | $450,300 | $139,400 | $310,900 |
| 2019 | $6,798 | $438,600 | $139,400 | $299,200 |
| 2018 | $5,149 | $426,400 | $135,900 | $290,500 |
| 2017 | $5,198 | $421,700 | $135,400 | $286,300 |
| 2016 | $5,240 | $429,300 | $135,400 | $293,900 |
| 2015 | $4,425 | $403,400 | $127,900 | $275,500 |
| 2014 | $4,425 | $353,500 | $121,600 | $231,900 |
Source: Public Records
Map
Nearby Homes
- 10495 Wharfdale Place
- 7313 Early Marker Ct
- 14734 Ducktan Loop
- 7399 Brunson Cir
- 7455 Brunson Cir
- 7510 Brunson Cir
- 14804 Cartagena Dr
- 7010 Old Carolina Rd
- 7436 Pensacola Place
- 15096 Gaffney Cir
- 7048 Sauvage Ln
- 14836 Cartagena Dr
- 14379 Hulfish Way
- 14410 Hulfish Way
- 7170 Little Thames Dr
- 7168 Little Thames Dr
- 6814 Jefferson St
- 7072 Little Thames Dr
- 6816 Fayette St
- 14585 Marlow St
- 7205 Forkland Way
- 10601 Wulford Ct
- 10621 Wulford Ct
- 10617 Wulford Ct
- 7208 Forkland Way
- 7201 Forkland Way
- 7212 Forkland Way
- 10625 Wulford Ct
- 7204 Forkland Way
- 7216 Forkland Way
- 10600 Wulford Ct
- 7200 Forkland Way
- 10512 Wharfdale Place
- 10604 Wulford Ct
- 7220 Forkland Way
- 10516 Wharfdale Place
- 10620 Wulford Ct
- 10616 Wulford Ct
- 10608 Wulford Ct
- 10508 Wharfdale Place