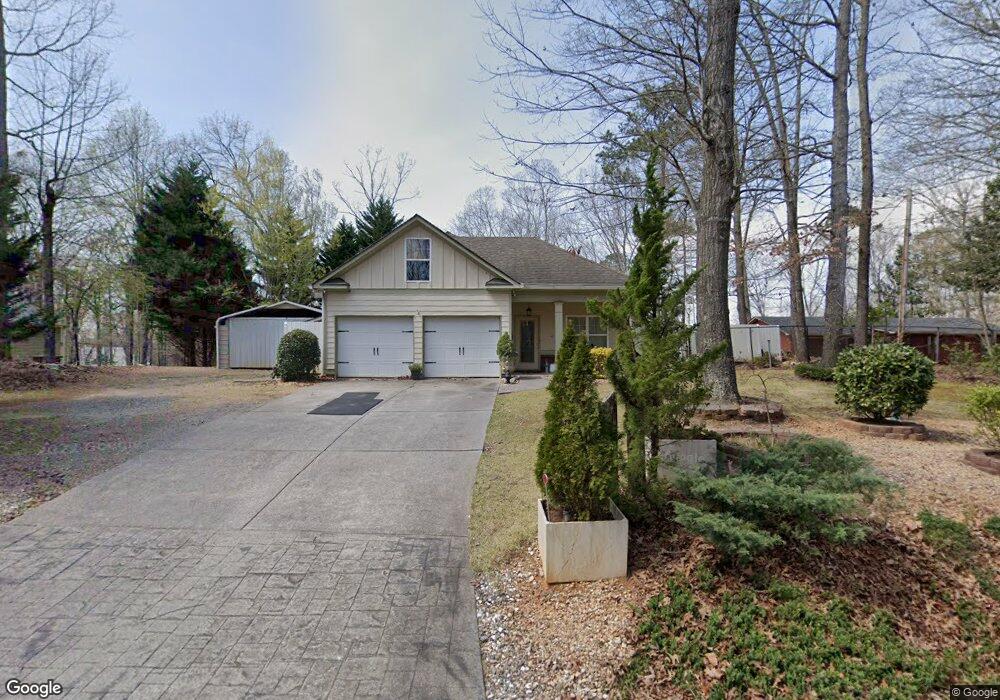
7209 Galts Ferry Rd Acworth, GA 30102
Oak Grove NeighborhoodEstimated Value: $367,000 - $479,000
2
Beds
2
Baths
2,017
Sq Ft
$208/Sq Ft
Est. Value
About This Home
This home is located at 7209 Galts Ferry Rd, Acworth, GA 30102 and is currently estimated at $418,925, approximately $207 per square foot. 7209 Galts Ferry Rd is a home located in Cherokee County with nearby schools including Clark Creek Elementary School, E. T. Booth Middle School, and Etowah High School.
Ownership History
Date
Name
Owned For
Owner Type
Purchase Details
Closed on
Apr 2, 2021
Sold by
Magnus Grant
Bought by
Magnus Grant and Magnus Amy
Current Estimated Value
Home Financials for this Owner
Home Financials are based on the most recent Mortgage that was taken out on this home.
Original Mortgage
$112,700
Outstanding Balance
$101,754
Interest Rate
3%
Mortgage Type
New Conventional
Estimated Equity
$317,171
Purchase Details
Closed on
Mar 7, 2018
Sold by
Magnus Barbara
Bought by
Grant Magnus and Magnus Amy
Home Financials for this Owner
Home Financials are based on the most recent Mortgage that was taken out on this home.
Original Mortgage
$136,850
Interest Rate
4.32%
Mortgage Type
New Conventional
Purchase Details
Closed on
Feb 14, 2006
Sold by
Rjk Homes Llc
Bought by
Magnus Raymond and Magnus Barbara
Home Financials for this Owner
Home Financials are based on the most recent Mortgage that was taken out on this home.
Original Mortgage
$162,400
Interest Rate
6.14%
Mortgage Type
New Conventional
Create a Home Valuation Report for This Property
The Home Valuation Report is an in-depth analysis detailing your home's value as well as a comparison with similar homes in the area
Home Values in the Area
Average Home Value in this Area
Purchase History
| Date | Buyer | Sale Price | Title Company |
|---|---|---|---|
| Magnus Grant | -- | -- | |
| Grant Magnus | $161,000 | -- | |
| Magnus Raymond | $203,000 | -- |
Source: Public Records
Mortgage History
| Date | Status | Borrower | Loan Amount |
|---|---|---|---|
| Open | Magnus Grant | $112,700 | |
| Previous Owner | Grant Magnus | $136,850 | |
| Previous Owner | Magnus Raymond | $162,400 |
Source: Public Records
Tax History Compared to Growth
Tax History
| Year | Tax Paid | Tax Assessment Tax Assessment Total Assessment is a certain percentage of the fair market value that is determined by local assessors to be the total taxable value of land and additions on the property. | Land | Improvement |
|---|---|---|---|---|
| 2024 | $1,137 | $180,692 | $22,000 | $158,692 |
| 2023 | $1,017 | $186,912 | $22,000 | $164,912 |
| 2022 | $1,067 | $144,372 | $22,000 | $122,372 |
| 2021 | $3,467 | $122,112 | $22,000 | $100,112 |
| 2020 | $3,355 | $118,088 | $22,000 | $96,088 |
| 2019 | $3,326 | $117,040 | $22,000 | $95,040 |
| 2018 | $712 | $92,080 | $18,000 | $74,080 |
| 2017 | $2,054 | $208,900 | $18,000 | $65,560 |
| 2016 | $2,054 | $182,200 | $18,000 | $54,880 |
| 2015 | $1,995 | $175,400 | $18,000 | $52,160 |
| 2014 | $2,239 | $195,800 | $18,000 | $60,320 |
Source: Public Records
Map
Nearby Homes
- 5 Yachting Way
- 2764 Still Lake Dr
- 4 Moss Landing Rd SE Unit LOT 7
- 4 Moss Landing Rd SE
- 10 Moss Landing Rd SE Unit LOT 8
- 10 Moss Landing Rd SE
- 3415 Spinnaker Way
- 0 Kellogg Creek Rd Unit 19587202
- 2753 Kellogg Creek Rd
- 3185 Kellogg Creek Rd
- 22 Allatoona Estates Dr SE
- 0 Rock Ridge Rd SE Unit 10591693
- 3470 Hill Ln
- 3290 Elwin Ragsdale Way
- 6502 Will Dupree Ln
- 6199 Brookside Ln
- 2431 Westland Way
- 912 Oak Dr
- 6746 Rock Ridge Rd SE
- 7211 Galts Ferry Rd
- 7207 Galts Ferry Rd
- 7195 Rocky Ln
- 7223 Galts Ferry Rd
- 7248 Rocky Ln Unit 82
- 7248 Rocky Ln
- 6935 Galts Ferry Rd
- 7173 Rocky Ln
- 7235 Galts Ferry Rd
- 7241 Rocky Ln
- 7250 Rocky Ln
- 7191 Rocky Ln
- 7185 Rocky Ln
- 3271 Galts Rd
- 7247 Galts Ferry Rd
- 7255 Rocky Ln
- 3259 Galts Rd
- 3317 Galts Rd
- 3317 Galts Rd
- 0 Rocky Ln Unit 7269201