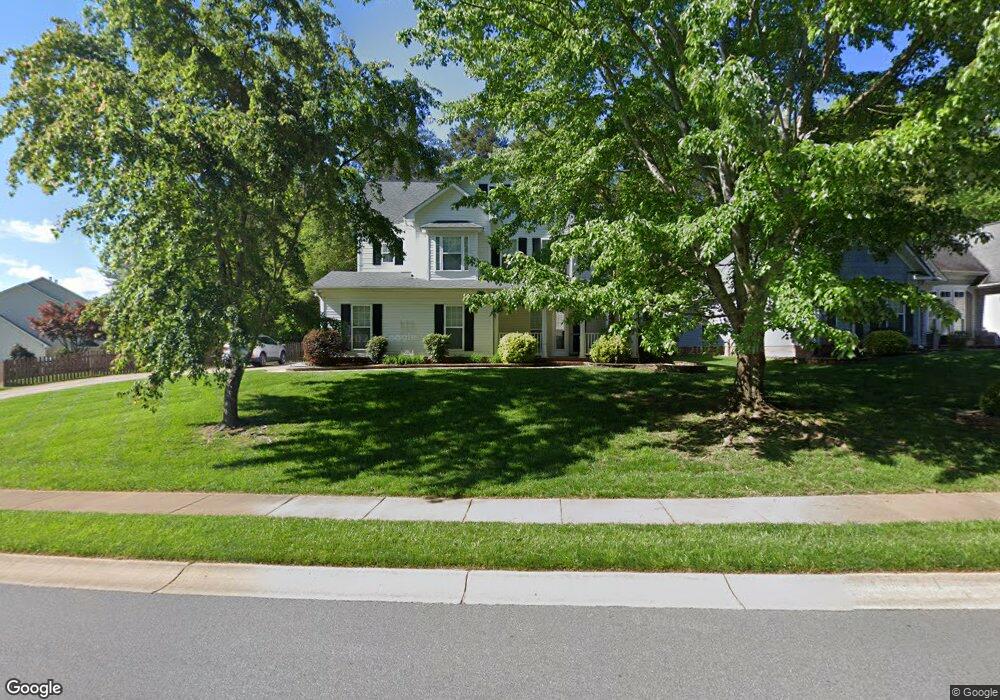
7209 Sedgebrook Dr W Unit 194 Stanley, NC 28164
Estimated Value: $467,000 - $511,000
4
Beds
3
Baths
2,455
Sq Ft
$201/Sq Ft
Est. Value
About This Home
This home is located at 7209 Sedgebrook Dr W Unit 194, Stanley, NC 28164 and is currently estimated at $494,477, approximately $201 per square foot. 7209 Sedgebrook Dr W Unit 194 is a home located in Lincoln County with nearby schools including Catawba Springs Elementary School, East Lincoln Middle School, and East Lincoln High School.
Ownership History
Date
Name
Owned For
Owner Type
Purchase Details
Closed on
Nov 19, 2015
Sold by
Freeman Dexter S and Freeman Christa Brittani
Bought by
Lineberger Brooke F and Lineberger John K
Current Estimated Value
Home Financials for this Owner
Home Financials are based on the most recent Mortgage that was taken out on this home.
Original Mortgage
$211,200
Outstanding Balance
$166,063
Interest Rate
3.78%
Mortgage Type
New Conventional
Estimated Equity
$328,415
Purchase Details
Closed on
Dec 3, 2012
Sold by
Sherril Denise Michele
Bought by
Freeman Dexter S and Freeman Brittani
Home Financials for this Owner
Home Financials are based on the most recent Mortgage that was taken out on this home.
Original Mortgage
$217,346
Interest Rate
3.4%
Mortgage Type
New Conventional
Purchase Details
Closed on
Dec 20, 2002
Bought by
Sherrill Denise Michele
Purchase Details
Closed on
Oct 2, 2002
Bought by
Niblock Development Corp
Create a Home Valuation Report for This Property
The Home Valuation Report is an in-depth analysis detailing your home's value as well as a comparison with similar homes in the area
Home Values in the Area
Average Home Value in this Area
Purchase History
| Date | Buyer | Sale Price | Title Company |
|---|---|---|---|
| Lineberger Brooke F | $264,000 | None Available | |
| Freeman Dexter S | $213,000 | None Available | |
| Sherrill Denise Michele | $216,000 | -- | |
| Niblock Development Corp | $30,600 | -- |
Source: Public Records
Mortgage History
| Date | Status | Borrower | Loan Amount |
|---|---|---|---|
| Open | Lineberger Brooke F | $211,200 | |
| Previous Owner | Freeman Dexter S | $217,346 |
Source: Public Records
Tax History Compared to Growth
Tax History
| Year | Tax Paid | Tax Assessment Tax Assessment Total Assessment is a certain percentage of the fair market value that is determined by local assessors to be the total taxable value of land and additions on the property. | Land | Improvement |
|---|---|---|---|---|
| 2025 | $2,941 | $463,760 | $82,000 | $381,760 |
| 2024 | $2,909 | $463,760 | $82,000 | $381,760 |
| 2023 | $2,904 | $463,760 | $82,000 | $381,760 |
| 2022 | $2,120 | $271,346 | $52,000 | $219,346 |
| 2021 | $2,134 | $271,346 | $52,000 | $219,346 |
| 2020 | $1,891 | $271,346 | $52,000 | $219,346 |
| 2019 | $1,891 | $271,346 | $52,000 | $219,346 |
| 2018 | $1,764 | $237,536 | $46,500 | $191,036 |
| 2017 | $1,663 | $237,536 | $46,500 | $191,036 |
| 2016 | $1,656 | $237,536 | $46,500 | $191,036 |
| 2015 | $1,782 | $237,536 | $46,500 | $191,036 |
| 2014 | $1,579 | $218,204 | $46,500 | $171,704 |
Source: Public Records
Map
Nearby Homes
- 7700 Sedgebrook Dr E
- 7563 Sedgebrook Dr W
- 1247 Carrington Dr
- 1230 Carrington Dr
- 1259 Carrington Dr
- 128 Killian Farm Rd
- 796 Cedarwood Ct
- 7484 Turkey Trot Dr
- 2227 Caravan Ln
- 955 Brookdale Ln Unit 436
- 963 Brookdale Ln
- McDowell Plan at Carrington
- Davidson Plan at Carrington
- Drexel Plan at Carrington
- Mayfair Plan at Carrington
- Wescott Plan at Carrington
- Edgefield Plan at Carrington
- Colfax Plan at Carrington
- Fenwick Plan at Carrington
- Sullivan Plan at Carrington
- 7209 Sedgebrook Dr W
- 7219 Sedgebrook Dr W
- 7191 Sedgebrook Dr W
- 7190 Sedgebrook Dr W
- 7229 Sedgebrook Dr W
- 7208 Sedgebrook Dr W Unit 409
- 7200 Sedgebrook Dr W
- 7181 Sedgebrook Dr W
- 7239 Sedgebrook Dr W
- 7184 Sedgebrook Dr W
- 7737 Sedgebrook Dr E
- 7173 Sedgebrook Dr W
- 7743 Sedgebrook Dr E
- 7249 Sedgebrook Dr W
- 7560 Easy Trail
- 7165 Sedgebrook Dr W
- 7727 Sedgebrook Dr E
- 7749 Sedgebrook Dr E
- 7259 Sedgebrook Dr W
- 7157 Sedgebrook Dr W