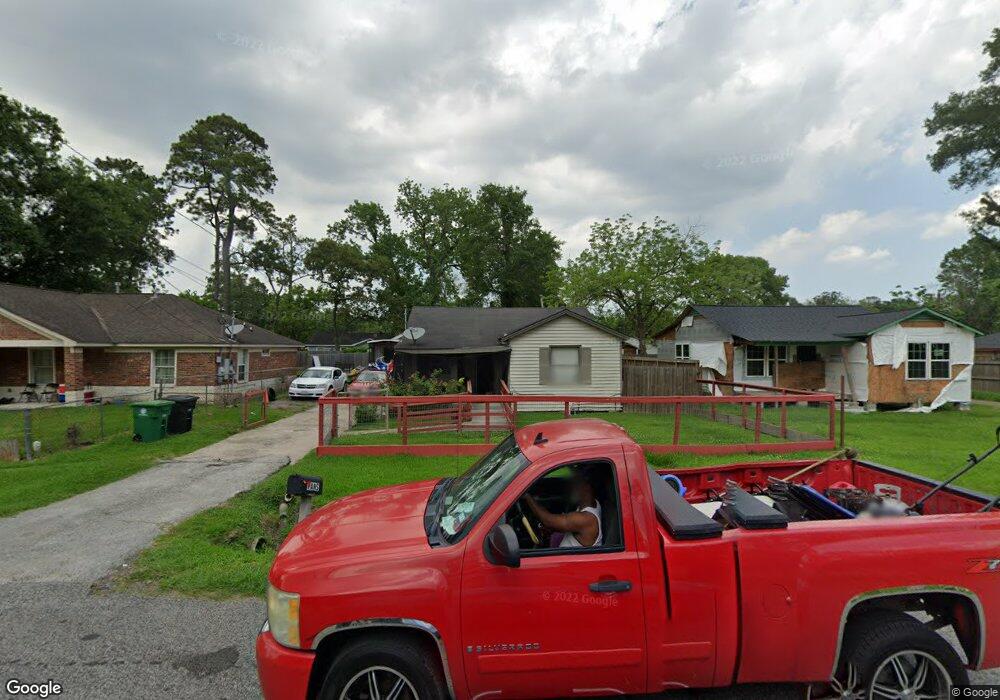
7209 W Knoll St Houston, TX 77028
Trinity-Houston Gardens NeighborhoodEstimated Value: $137,000 - $173,000
3
Beds
2
Baths
1,100
Sq Ft
$139/Sq Ft
Est. Value
About This Home
This home is located at 7209 W Knoll St, Houston, TX 77028 and is currently estimated at $152,420, approximately $138 per square foot. 7209 W Knoll St is a home located in Harris County with nearby schools including McGowen Elementary School, Key Middle, and Kashmere High School.
Ownership History
Date
Name
Owned For
Owner Type
Purchase Details
Closed on
Feb 18, 2015
Sold by
Vistamont Realty Management Inc
Bought by
Vanschunta W and Van Warren G
Current Estimated Value
Home Financials for this Owner
Home Financials are based on the most recent Mortgage that was taken out on this home.
Original Mortgage
$79,620
Outstanding Balance
$61,028
Interest Rate
3.78%
Mortgage Type
Purchase Money Mortgage
Estimated Equity
$91,392
Purchase Details
Closed on
Jan 11, 2013
Sold by
Berntsen Kenneth and Rivera Angel R
Bought by
Vistamont Realty Management Ic
Purchase Details
Closed on
Jan 20, 2011
Sold by
Vistamont Realty Management Inc
Bought by
Rivera Angel Roman and Rivera Rosa Maria
Purchase Details
Closed on
May 11, 2010
Sold by
Melancon Vester F and Melancon Fayrella
Bought by
Vistamont Realty Management Inc
Purchase Details
Closed on
Oct 30, 2007
Sold by
Melancon Vester
Bought by
Melancon Vester and Estate Of Willie Roy Benson
Create a Home Valuation Report for This Property
The Home Valuation Report is an in-depth analysis detailing your home's value as well as a comparison with similar homes in the area
Home Values in the Area
Average Home Value in this Area
Purchase History
| Date | Buyer | Sale Price | Title Company |
|---|---|---|---|
| Vanschunta W | -- | None Available | |
| Vistamont Realty Management Ic | -- | -- | |
| Vistamont Realty Management Ic | -- | -- | |
| Rivera Angel Roman | -- | None Available | |
| Vistamont Realty Management Inc | -- | Fidelity National Title | |
| Melancon Vester | -- | None Available |
Source: Public Records
Mortgage History
| Date | Status | Borrower | Loan Amount |
|---|---|---|---|
| Open | Vanschunta W | $79,620 | |
| Closed | Rivera Angel Roman | $0 |
Source: Public Records
Tax History Compared to Growth
Tax History
| Year | Tax Paid | Tax Assessment Tax Assessment Total Assessment is a certain percentage of the fair market value that is determined by local assessors to be the total taxable value of land and additions on the property. | Land | Improvement |
|---|---|---|---|---|
| 2025 | $783 | $113,851 | $58,890 | $54,961 |
| 2024 | $783 | $116,420 | $58,890 | $57,530 |
| 2023 | $783 | $108,230 | $50,700 | $57,530 |
| 2022 | $1,450 | $85,204 | $35,100 | $50,104 |
| 2021 | $1,396 | $60,820 | $17,550 | $43,270 |
| 2020 | $1,318 | $60,820 | $17,550 | $43,270 |
| 2019 | $1,252 | $54,970 | $11,700 | $43,270 |
| 2018 | $613 | $44,987 | $11,700 | $33,287 |
| 2017 | $1,138 | $44,987 | $11,700 | $33,287 |
| 2016 | $1,138 | $44,987 | $11,700 | $33,287 |
| 2015 | -- | $44,987 | $11,700 | $33,287 |
| 2014 | -- | $30,000 | $11,700 | $18,300 |
Source: Public Records
Map
Nearby Homes
- 7100 W Knoll St
- 7214 Weyburn St
- 7307 W Knoll St
- 8100 Homestead Rd
- 7309 Orville St
- 7140 Orville St
- 7101 Weyburn St Unit C
- 7206 Bywood St
- 7126 Bywood A and B St
- 7010 S Hall St
- 7126 Bywood St
- 7002 S Hall St
- 7413 W Knoll St
- 6908 S Hall St
- 7429 W Knoll St
- 6842 Carothers St
- 7229 Touchstone St
- 7325 Ley Rd
- 6838 Carothers St
- 7327 Ley Rd
- 7205 W Knoll St
- 7210 Hall St
- 7208 S Hall St
- 7214 S Hall St
- 7221 W Knoll St
- 7206 S Hall St
- 7133 W Knoll St
- 7210 W Knoll St
- 7214 W Knoll St
- 7206 W Knoll St
- 7226 S Hall St
- 7138 S Hall St
- 7218 W Knoll St
- 7202 W Knoll St
- 7122 W Knoll St
- 7134 S Hall St
- 7229 W Knoll St
- 7230 S Hall St
- 7129 W Knoll St
- 7129 W Knoll St