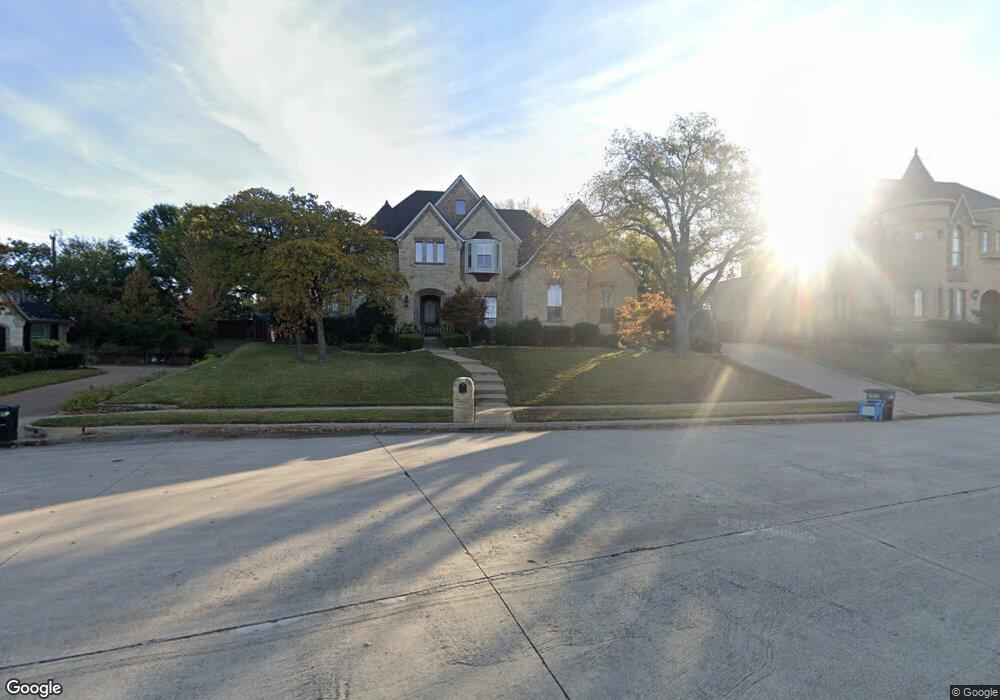
7209 Waldon Ct Colleyville, TX 76034
Estimated Value: $1,063,396 - $1,204,000
4
Beds
4
Baths
4,324
Sq Ft
$261/Sq Ft
Est. Value
About This Home
This home is located at 7209 Waldon Ct, Colleyville, TX 76034 and is currently estimated at $1,128,349, approximately $260 per square foot. 7209 Waldon Ct is a home located in Tarrant County with nearby schools including Colleyville Elementary School, Cross Timbers Middle School, and Grapevine High School.
Ownership History
Date
Name
Owned For
Owner Type
Purchase Details
Closed on
Jul 10, 2015
Sold by
Taylor Jason and Taylor Kelly
Bought by
Troung Richard
Current Estimated Value
Home Financials for this Owner
Home Financials are based on the most recent Mortgage that was taken out on this home.
Original Mortgage
$200,000
Outstanding Balance
$156,220
Interest Rate
3.91%
Mortgage Type
Purchase Money Mortgage
Estimated Equity
$972,129
Purchase Details
Closed on
Feb 16, 2002
Sold by
Otten Ray
Bought by
Taylor Jason and Taylor Kelly
Home Financials for this Owner
Home Financials are based on the most recent Mortgage that was taken out on this home.
Original Mortgage
$90,000
Interest Rate
6.93%
Purchase Details
Closed on
Jul 20, 2000
Sold by
Centurion American Custom Homes Inc
Bought by
Ray Otten Construction
Create a Home Valuation Report for This Property
The Home Valuation Report is an in-depth analysis detailing your home's value as well as a comparison with similar homes in the area
Home Values in the Area
Average Home Value in this Area
Purchase History
| Date | Buyer | Sale Price | Title Company |
|---|---|---|---|
| Troung Richard | -- | Ttt | |
| Taylor Jason | -- | Alamo Title Company | |
| Ray Otten Construction | -- | Commonwealth Land Title |
Source: Public Records
Mortgage History
| Date | Status | Borrower | Loan Amount |
|---|---|---|---|
| Open | Troung Richard | $200,000 | |
| Previous Owner | Taylor Jason | $90,000 |
Source: Public Records
Tax History Compared to Growth
Tax History
| Year | Tax Paid | Tax Assessment Tax Assessment Total Assessment is a certain percentage of the fair market value that is determined by local assessors to be the total taxable value of land and additions on the property. | Land | Improvement |
|---|---|---|---|---|
| 2025 | $3,559 | $722,274 | $166,850 | $555,424 |
| 2024 | $3,559 | $874,000 | $166,850 | $707,150 |
| 2023 | $13,512 | $900,000 | $166,850 | $733,150 |
| 2022 | $15,740 | $807,525 | $166,850 | $640,675 |
| 2021 | $15,910 | $743,721 | $100,110 | $643,611 |
| 2020 | $14,635 | $658,627 | $100,110 | $558,517 |
| 2019 | $15,286 | $661,148 | $100,110 | $561,038 |
| 2018 | $3,687 | $620,250 | $100,110 | $520,140 |
| 2017 | $14,653 | $620,250 | $100,110 | $520,140 |
| 2016 | $14,824 | $627,502 | $97,110 | $530,392 |
| 2015 | $13,220 | $579,000 | $110,000 | $469,000 |
| 2014 | $13,220 | $579,000 | $110,000 | $469,000 |
Source: Public Records
Map
Nearby Homes
- 7312 Hix Ct
- TBD - Lot 3 John Mccain Rd
- TBD - Lot 1 John Mccain Rd
- 7255 Oak Alley Dr
- 7000 Shalimar Ct
- 7012 Shepherds Glen
- 6900 Sir Spencer Ct
- 6805 Shalimar Ct
- 7200 Belle Meade Dr
- 7106 Belle Meade Dr
- 7322 Calloway Ct
- 7316 Calloway Ct
- 1417 Nottoway Ct
- 1418 Nottoway Ct
- 1406 Nottoway Ct
- 1227 Strathmore Dr
- 7212 John Mccain Rd
- 7607 Monticello Pkwy
- 608 Regency Crossing
- 7400 John Mccain Rd
- 7205 Waldon Ct
- 7213 Waldon Ct
- 7300 Jo Will St
- 7208 Jo Will St
- 7304 Jo Will St
- 7201 Waldon Ct
- 7208 Waldon Ct
- 7212 Waldon Ct
- 7204 Waldon Ct
- 7204 Jo Will St
- 7200 Waldon Ct
- 7308 Jo Will St
- 7301 Jo Will St
- 7209 Jo Will St
- 7305 Jo Will St
- 7205 Jo Will St
- 7113 Waldon Ct
- 7309 Jo Will St
- 7200 Jo Will St
- 7312 Jo Will St