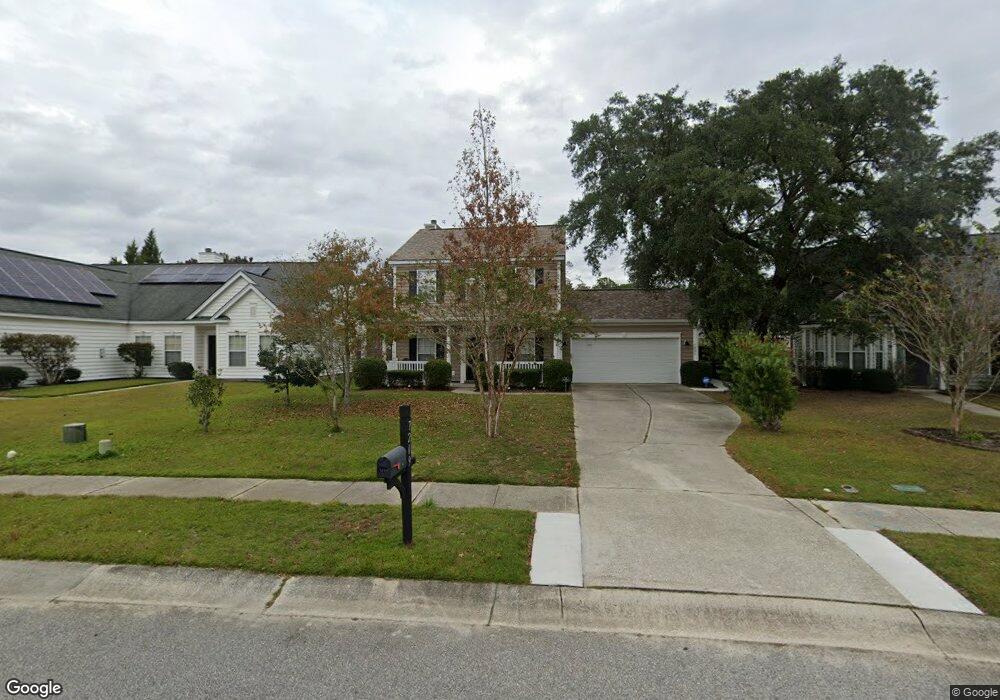
7209 Wistling Godwit Way Hanahan, SC 29410
Estimated Value: $426,146 - $498,000
--
Bed
--
Bath
1,940
Sq Ft
$242/Sq Ft
Est. Value
About This Home
This home is located at 7209 Wistling Godwit Way, Hanahan, SC 29410 and is currently estimated at $468,787, approximately $241 per square foot. 7209 Wistling Godwit Way is a home located in Berkeley County with nearby schools including Bowen's Corner Elementary, Hanahan Middle School, and Hanahan High School.
Ownership History
Date
Name
Owned For
Owner Type
Purchase Details
Closed on
Jun 8, 2018
Sold by
Kinser Roy L
Bought by
Irizarry Xavier and Irizarry Glenda F
Current Estimated Value
Home Financials for this Owner
Home Financials are based on the most recent Mortgage that was taken out on this home.
Original Mortgage
$228,000
Outstanding Balance
$197,182
Interest Rate
4.5%
Mortgage Type
New Conventional
Estimated Equity
$271,605
Purchase Details
Closed on
Oct 19, 2005
Sold by
Beazer Homes Corp
Bought by
Kinser Roy L
Home Financials for this Owner
Home Financials are based on the most recent Mortgage that was taken out on this home.
Original Mortgage
$157,100
Interest Rate
5%
Mortgage Type
Adjustable Rate Mortgage/ARM
Purchase Details
Closed on
Dec 8, 2004
Sold by
Charleston Brown Co Llc
Bought by
Beazer Homes Corp
Create a Home Valuation Report for This Property
The Home Valuation Report is an in-depth analysis detailing your home's value as well as a comparison with similar homes in the area
Home Values in the Area
Average Home Value in this Area
Purchase History
| Date | Buyer | Sale Price | Title Company |
|---|---|---|---|
| Irizarry Xavier | $285,000 | None Available | |
| Kinser Roy L | $196,405 | None Available | |
| Beazer Homes Corp | $212,160 | -- |
Source: Public Records
Mortgage History
| Date | Status | Borrower | Loan Amount |
|---|---|---|---|
| Open | Irizarry Xavier | $228,000 | |
| Previous Owner | Kinser Roy L | $157,100 |
Source: Public Records
Tax History Compared to Growth
Tax History
| Year | Tax Paid | Tax Assessment Tax Assessment Total Assessment is a certain percentage of the fair market value that is determined by local assessors to be the total taxable value of land and additions on the property. | Land | Improvement |
|---|---|---|---|---|
| 2025 | $1,557 | $327,060 | $67,020 | $260,040 |
| 2024 | $1,557 | $13,083 | $2,681 | $10,402 |
| 2023 | $1,557 | $13,083 | $2,681 | $10,402 |
| 2022 | $1,480 | $11,376 | $1,800 | $9,576 |
| 2021 | $1,394 | $11,380 | $1,800 | $9,576 |
| 2020 | $1,313 | $11,376 | $1,800 | $9,576 |
| 2019 | $1,362 | $11,376 | $1,800 | $9,576 |
| 2018 | $4,153 | $8,464 | $1,720 | $6,744 |
| 2017 | $4,126 | $12,696 | $2,580 | $10,116 |
| 2016 | $1,292 | $8,460 | $1,720 | $6,740 |
| 2015 | $1,134 | $8,460 | $1,720 | $6,740 |
| 2014 | $1,113 | $8,460 | $1,720 | $6,740 |
| 2013 | -- | $8,460 | $1,720 | $6,740 |
Source: Public Records
Map
Nearby Homes
- 7242 Sweetgrass Blvd
- 7316 Water Thrush Ct
- 7317 Horned Grebe Ct
- 7304 Kestrel Trail
- 7303 Kestrel Trail
- 7316 Stoney Moss Way
- 7326 Kestrel Trail
- 7358 Suncatcher Dr
- 1333 Song Sparrow Way
- 1303 Windover Run
- 1203 Saffron Ln
- 7434 Northgate Dr
- 7402 Purser Ln
- 1235 Woodsage Dr
- 7217 Mossy Creek Ln
- 7406 Mercedes Way
- 8604 Bowen Corner Ave
- 9211 Bowen Corner Ave
- 7502 Scupper Dr
- 3008 Evening Tide Dr
- 7211 Wistling Godwit Way
- 7207 Wistling Godwit Way
- 7220 Harrier Dr
- 7222 Harrier Dr
- 7213 Wistling Godwit Way
- 7205 Wistling Godwit Way
- 7218 Harrier Dr
- 7224 Harrier Dr
- 7208 Wistling Godwit Way
- 7203 Wistling Godwit Way
- 7210 Wistling Godwit Way
- 7215 Wistling Godwit Way
- 7216 Harrier Dr
- 7202 Wistling Godwit Way
- 7226 Harrier Dr
- 7212 Wistling Godwit Way
- 7201 Wistling Godwit Way
- 7217 Wistling Godwit Way
- 7214 Harrier Dr
- 1408 Coopers Hawk Dr