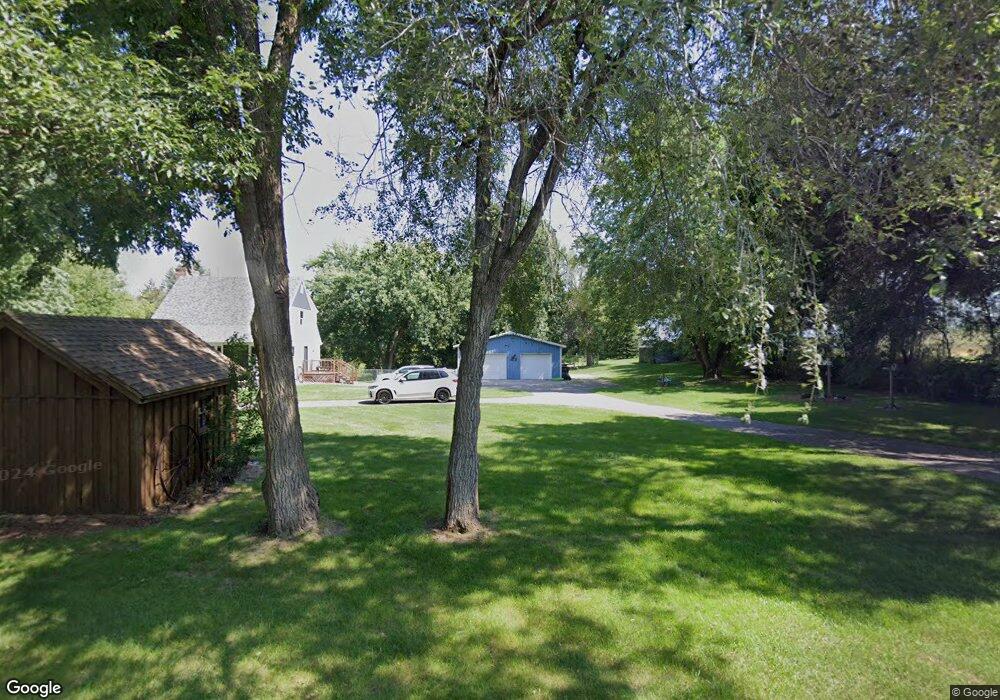
721 112th St Roberts, WI 54023
Warren NeighborhoodEstimated Value: $525,000 - $630,000
3
Beds
2
Baths
2,360
Sq Ft
$240/Sq Ft
Est. Value
About This Home
This home is located at 721 112th St, Roberts, WI 54023 and is currently estimated at $567,189, approximately $240 per square foot. 721 112th St is a home located in St. Croix County with nearby schools including Saint Croix Central Elementary School, Saint Croix Central Middle School, and St. Croix Central High School.
Ownership History
Date
Name
Owned For
Owner Type
Purchase Details
Closed on
Jan 26, 2021
Sold by
Bengtson Devon K
Bought by
Goetsch Fallon J and Goetsch Troy
Current Estimated Value
Home Financials for this Owner
Home Financials are based on the most recent Mortgage that was taken out on this home.
Original Mortgage
$242,900
Outstanding Balance
$214,632
Interest Rate
2.67%
Mortgage Type
New Conventional
Estimated Equity
$352,557
Purchase Details
Closed on
Aug 21, 2015
Sold by
Naumann Justus David and Naumann Carolyn P
Bought by
Bengtson Devon K
Home Financials for this Owner
Home Financials are based on the most recent Mortgage that was taken out on this home.
Original Mortgage
$230,450
Interest Rate
4.09%
Mortgage Type
New Conventional
Purchase Details
Closed on
Jan 6, 2011
Sold by
Naumann Dora Jean
Bought by
Naumann Justus David
Create a Home Valuation Report for This Property
The Home Valuation Report is an in-depth analysis detailing your home's value as well as a comparison with similar homes in the area
Home Values in the Area
Average Home Value in this Area
Purchase History
| Date | Buyer | Sale Price | Title Company |
|---|---|---|---|
| Goetsch Fallon J | $425,900 | Legacy Title | |
| Bengtson Devon K | $242,600 | Edina Realty Title Inc | |
| Naumann Justus David | -- | None Available |
Source: Public Records
Mortgage History
| Date | Status | Borrower | Loan Amount |
|---|---|---|---|
| Open | Goetsch Fallon J | $242,900 | |
| Previous Owner | Bengtson Devon K | $230,450 |
Source: Public Records
Tax History
| Year | Tax Paid | Tax Assessment Tax Assessment Total Assessment is a certain percentage of the fair market value that is determined by local assessors to be the total taxable value of land and additions on the property. | Land | Improvement |
|---|---|---|---|---|
| 2025 | $4,660 | $421,000 | $163,000 | $258,000 |
| 2024 | $45 | $421,000 | $163,000 | $258,000 |
| 2023 | $3,845 | $245,300 | $113,000 | $132,300 |
| 2022 | $3,545 | $245,300 | $113,000 | $132,300 |
| 2021 | $3,619 | $245,300 | $113,000 | $132,300 |
| 2020 | $3,465 | $245,300 | $113,000 | $132,300 |
| 2019 | $3,295 | $245,300 | $113,000 | $132,300 |
| 2018 | $3,434 | $245,300 | $113,000 | $132,300 |
| 2017 | $3,635 | $190,500 | $84,000 | $106,500 |
| 2016 | $3,635 | $190,500 | $84,000 | $106,500 |
| 2015 | $3,237 | $190,500 | $84,000 | $106,500 |
| 2014 | $3,216 | $190,500 | $84,000 | $106,500 |
| 2013 | $3,068 | $190,500 | $84,000 | $106,500 |
Source: Public Records
Map
Nearby Homes
- 643 100th (Lot 4) St
- 642 Franklin St
- 634 Franklin St
- TBD Lot 10 65th Ave
- 630 Franklin St
- 628 Franklin St
- 603 S Division St
- 601 S Division St
- 621 Field Point St
- 617 Field Point St
- XXXX 100th Street St
- 615 Field Point St
- 613 Field Point St
- 607 Field Point St
- 603 Field Point St
- 610 Field Point St
- 112 W Brewer St
- 202 W Warren St
- 306 N Division St
- 880 110th St
Your Personal Tour Guide
Ask me questions while you tour the home.