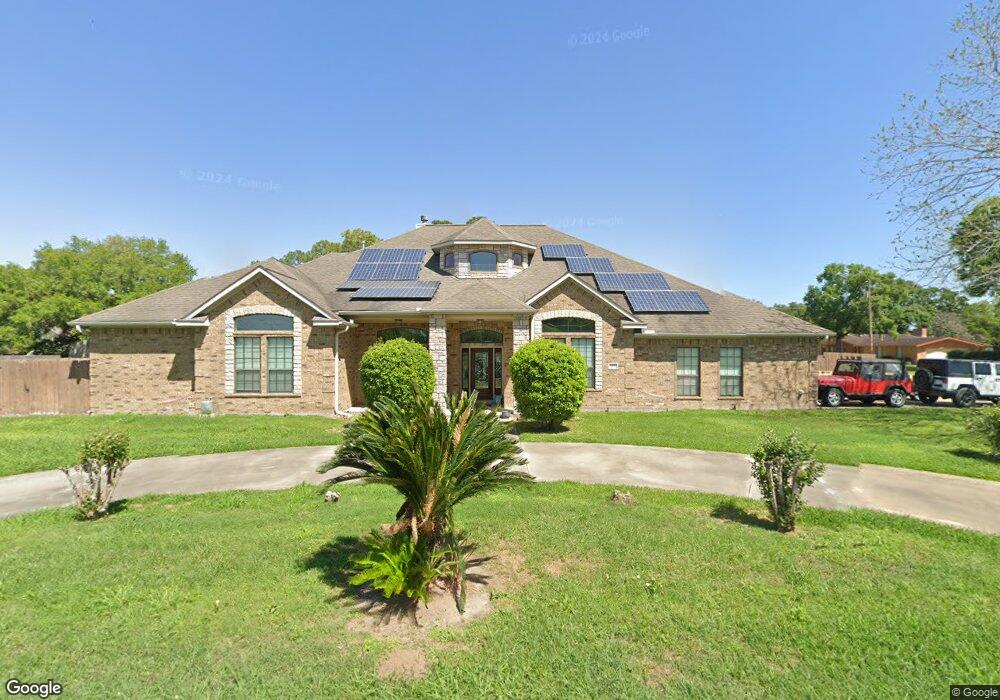
721 2nd St Bay City, TX 77414
Estimated Value: $342,000 - $470,000
4
Beds
4
Baths
3,401
Sq Ft
$115/Sq Ft
Est. Value
About This Home
This home is located at 721 2nd St, Bay City, TX 77414 and is currently estimated at $391,881, approximately $115 per square foot. 721 2nd St is a home located in Matagorda County with nearby schools including John H. Cherry Elementary School, Bay City Junior High School, and Bay City High School.
Ownership History
Date
Name
Owned For
Owner Type
Purchase Details
Closed on
Sep 4, 2013
Sold by
Dada Mohammed A and Dada Uzma Rahat
Bought by
Potts Ginger L and Potts Nathan E
Current Estimated Value
Home Financials for this Owner
Home Financials are based on the most recent Mortgage that was taken out on this home.
Original Mortgage
$389,500
Outstanding Balance
$290,197
Interest Rate
4.36%
Mortgage Type
VA
Estimated Equity
$101,684
Purchase Details
Closed on
Jun 8, 2007
Sold by
Finlay Mark and Finlay Jean Ann
Bought by
Weaver John and Davenport Tim
Create a Home Valuation Report for This Property
The Home Valuation Report is an in-depth analysis detailing your home's value as well as a comparison with similar homes in the area
Home Values in the Area
Average Home Value in this Area
Purchase History
| Date | Buyer | Sale Price | Title Company |
|---|---|---|---|
| Potts Ginger L | -- | None Available | |
| Weaver John | -- | -- |
Source: Public Records
Mortgage History
| Date | Status | Borrower | Loan Amount |
|---|---|---|---|
| Open | Potts Ginger L | $389,500 |
Source: Public Records
Tax History Compared to Growth
Tax History
| Year | Tax Paid | Tax Assessment Tax Assessment Total Assessment is a certain percentage of the fair market value that is determined by local assessors to be the total taxable value of land and additions on the property. | Land | Improvement |
|---|---|---|---|---|
| 2024 | $101 | $433,760 | $60,000 | $373,760 |
| 2023 | $10,040 | $430,900 | $43,950 | $386,950 |
| 2022 | $10,613 | $397,450 | $43,950 | $353,500 |
| 2021 | $11,795 | $401,460 | $43,950 | $357,510 |
| 2020 | $11,643 | $380,970 | $43,950 | $337,020 |
| 2019 | $11,751 | $384,710 | $43,950 | $340,760 |
| 2018 | $11,444 | $388,460 | $43,950 | $344,510 |
| 2017 | $10,950 | $392,200 | $43,950 | $348,250 |
| 2016 | $11,055 | $395,940 | $43,950 | $351,990 |
| 2015 | -- | $367,350 | $43,950 | $323,400 |
| 2014 | -- | $389,990 | $43,950 | $346,040 |
Source: Public Records
Map
Nearby Homes