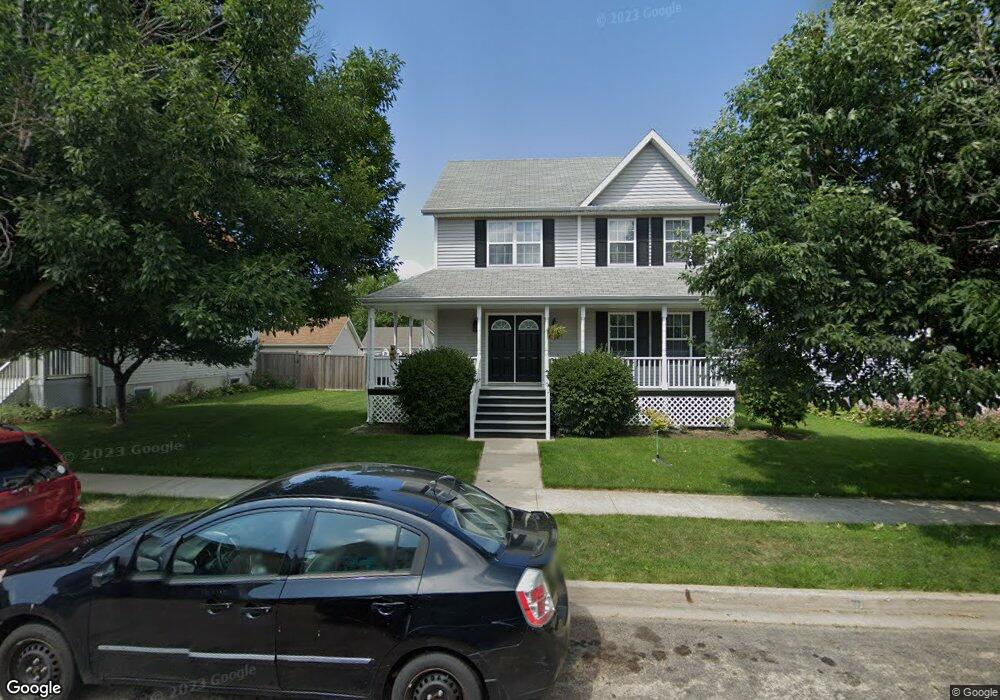
721 Benham St Kirkland, IL 60146
Estimated Value: $253,000 - $267,000
4
Beds
3
Baths
1,600
Sq Ft
$163/Sq Ft
Est. Value
About This Home
This home is located at 721 Benham St, Kirkland, IL 60146 and is currently estimated at $260,452, approximately $162 per square foot. 721 Benham St is a home located in DeKalb County with nearby schools including Hiawatha Elementary School and Hiawatha Jr./Sr. High School.
Ownership History
Date
Name
Owned For
Owner Type
Purchase Details
Closed on
Jun 23, 2021
Sold by
Leach Roger L and Leach Linda L
Bought by
Manzano Alvaro
Current Estimated Value
Home Financials for this Owner
Home Financials are based on the most recent Mortgage that was taken out on this home.
Original Mortgage
$148,000
Outstanding Balance
$136,167
Interest Rate
4%
Mortgage Type
New Conventional
Estimated Equity
$124,285
Purchase Details
Closed on
Apr 17, 2007
Sold by
Bank Of New York
Bought by
Leach Roger L and Leach Linda L
Home Financials for this Owner
Home Financials are based on the most recent Mortgage that was taken out on this home.
Original Mortgage
$124,720
Interest Rate
6.2%
Mortgage Type
New Conventional
Purchase Details
Closed on
Dec 19, 2006
Sold by
Dekalb County Sheriff
Bought by
Bank Of New York
Create a Home Valuation Report for This Property
The Home Valuation Report is an in-depth analysis detailing your home's value as well as a comparison with similar homes in the area
Home Values in the Area
Average Home Value in this Area
Purchase History
| Date | Buyer | Sale Price | Title Company |
|---|---|---|---|
| Manzano Alvaro | $185,000 | Chicago Title | |
| Leach Roger L | $156,000 | -- | |
| Bank Of New York | -- | -- |
Source: Public Records
Mortgage History
| Date | Status | Borrower | Loan Amount |
|---|---|---|---|
| Open | Manzano Alvaro | $148,000 | |
| Previous Owner | Leach Roger L | $124,720 |
Source: Public Records
Tax History
| Year | Tax Paid | Tax Assessment Tax Assessment Total Assessment is a certain percentage of the fair market value that is determined by local assessors to be the total taxable value of land and additions on the property. | Land | Improvement |
|---|---|---|---|---|
| 2025 | $5,935 | $74,101 | $13,654 | $60,447 |
| 2024 | $5,587 | $68,549 | $12,631 | $55,918 |
| 2023 | $5,459 | $63,138 | $11,634 | $51,504 |
| 2022 | $5,459 | $61,484 | $11,329 | $50,155 |
| 2021 | $5,616 | $54,883 | $10,923 | $43,960 |
| 2020 | $5,442 | $52,101 | $10,369 | $41,732 |
| 2019 | $5,373 | $50,569 | $10,064 | $40,505 |
| 2018 | $4,933 | $46,184 | $9,778 | $36,406 |
| 2017 | $4,814 | $45,022 | $9,532 | $35,490 |
| 2016 | $4,790 | $44,010 | $9,318 | $34,692 |
| 2015 | -- | $41,304 | $8,745 | $32,559 |
| 2014 | -- | $45,358 | $8,087 | $37,271 |
| 2013 | -- | $46,680 | $8,323 | $38,357 |
Source: Public Records
Map
Nearby Homes
Your Personal Tour Guide
Ask me questions while you tour the home.