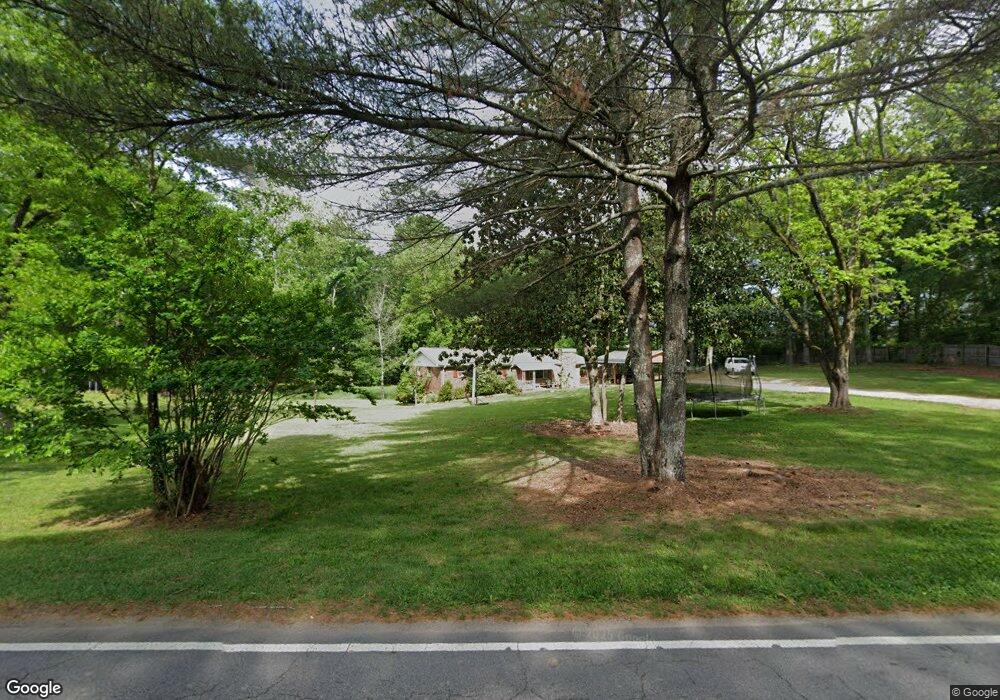
721 Burns Rd Carrollton, GA 30117
Estimated Value: $205,000 - $294,000
3
Beds
1
Bath
1,350
Sq Ft
$182/Sq Ft
Est. Value
About This Home
This home is located at 721 Burns Rd, Carrollton, GA 30117 and is currently estimated at $246,001, approximately $182 per square foot. 721 Burns Rd is a home located in Carroll County with nearby schools including Carrollton Elementary School, Carrollton Upper Elementary School, and Carrollton Middle School.
Ownership History
Date
Name
Owned For
Owner Type
Purchase Details
Closed on
Jul 24, 2018
Sold by
Cjc Development Llc
Bought by
Rodriguez Jose and Diaz Rivera Cenia L
Current Estimated Value
Home Financials for this Owner
Home Financials are based on the most recent Mortgage that was taken out on this home.
Original Mortgage
$37,450
Interest Rate
4.5%
Mortgage Type
New Conventional
Purchase Details
Closed on
Jun 28, 2018
Sold by
Cooley Hazel
Bought by
Cjc Development Llc
Home Financials for this Owner
Home Financials are based on the most recent Mortgage that was taken out on this home.
Original Mortgage
$37,450
Interest Rate
4.5%
Mortgage Type
New Conventional
Purchase Details
Closed on
Mar 25, 2013
Sold by
Boyd Brenda
Bought by
Cooley Hazel
Purchase Details
Closed on
Jun 30, 2008
Sold by
Not Provided
Bought by
Cooley W J and Cooley Hazel
Purchase Details
Closed on
Jun 2, 1962
Sold by
Buchanan J D
Bought by
Zachery Miles
Create a Home Valuation Report for This Property
The Home Valuation Report is an in-depth analysis detailing your home's value as well as a comparison with similar homes in the area
Home Values in the Area
Average Home Value in this Area
Purchase History
| Date | Buyer | Sale Price | Title Company |
|---|---|---|---|
| Rodriguez Jose | $88,000 | -- | |
| Cjc Development Llc | $53,500 | -- | |
| Cooley Hazel | -- | -- | |
| Cooley Hazel | -- | -- | |
| Cooley Hazel | -- | -- | |
| Cooley Hazel | -- | -- | |
| Cooley W J | -- | -- | |
| Cooley W J | -- | -- | |
| Zachery Miles | -- | -- |
Source: Public Records
Mortgage History
| Date | Status | Borrower | Loan Amount |
|---|---|---|---|
| Closed | Cjc Development Llc | $37,450 |
Source: Public Records
Tax History Compared to Growth
Tax History
| Year | Tax Paid | Tax Assessment Tax Assessment Total Assessment is a certain percentage of the fair market value that is determined by local assessors to be the total taxable value of land and additions on the property. | Land | Improvement |
|---|---|---|---|---|
| 2024 | $1,896 | $69,386 | $23,814 | $45,572 |
| 2023 | $1,896 | $65,422 | $23,814 | $41,608 |
| 2022 | $1,446 | $49,542 | $15,876 | $33,666 |
| 2021 | $1,192 | $40,826 | $11,760 | $29,066 |
| 2020 | $1,100 | $37,634 | $11,760 | $25,874 |
| 2019 | $1,037 | $35,160 | $11,760 | $23,400 |
| 2018 | $977 | $32,638 | $11,760 | $20,878 |
| 2017 | $982 | $32,638 | $11,760 | $20,878 |
| 2016 | $839 | $32,638 | $11,760 | $20,878 |
| 2015 | $719 | $23,287 | $10,000 | $13,287 |
| 2014 | $722 | $23,287 | $10,000 | $13,287 |
Source: Public Records
Map
Nearby Homes
- 0 Burns Rd Unit LOT 2 10571612
- 0 Burns Rd Unit LOT 3 10571635
- 0 Burns Rd Unit LOT 1 10571595
- 0 Burns Rd Unit 148013
- 8 Horsley Mill Rd
- 9 Horsley Mill Rd
- 208 Lane Dr
- 208 Lane Dr Unit LOT 62
- 0 Carroll Cir Unit LOTS 4-8 10571562
- 403 Burns Rd
- 114 Bennett Cir
- 150 Cedar Park Way
- Plan 2121 at Canterbury Villas
- Plan 2307 at Canterbury Villas
- 204 Chaucer Ln
- Plan 1522 at Canterbury Villas
- Plan 1634 at Canterbury Villas
- Plan 2628 at Canterbury Villas
- 204 Burns Rd
- 112 Lane Dr