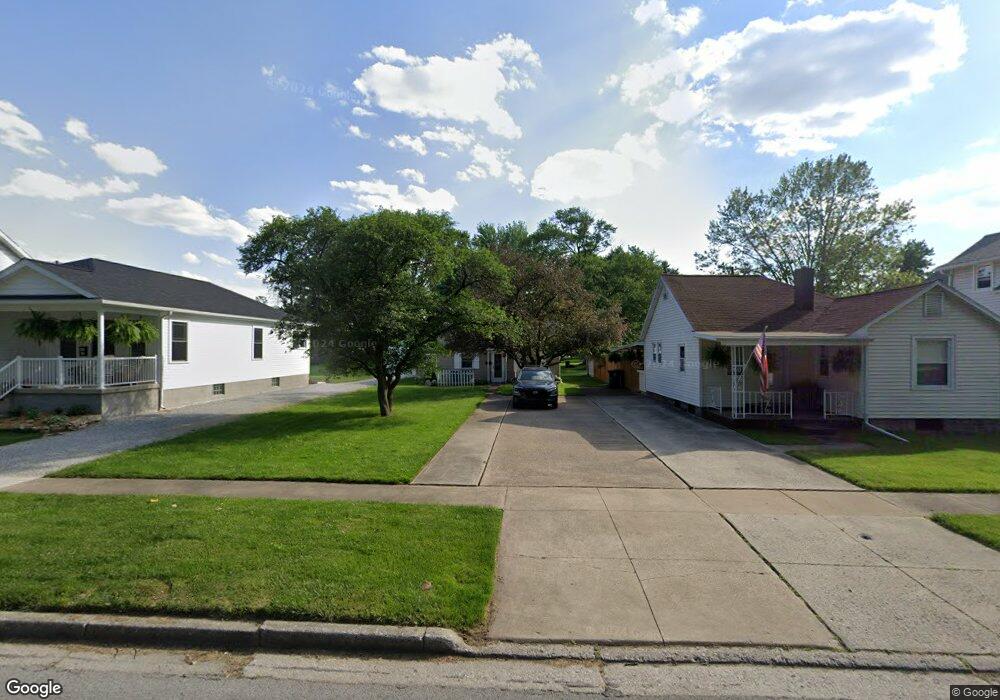
721 Chestnut St Fremont, OH 43420
Estimated Value: $112,373 - $143,000
3
Beds
1
Bath
1,056
Sq Ft
$119/Sq Ft
Est. Value
About This Home
This home is located at 721 Chestnut St, Fremont, OH 43420 and is currently estimated at $125,343, approximately $118 per square foot. 721 Chestnut St is a home located in Sandusky County with nearby schools including Fremont Ross High School, Sacred Heart School, and Bishop Hoffman Catholic School - This is St Joe's School now.
Ownership History
Date
Name
Owned For
Owner Type
Purchase Details
Closed on
May 6, 2020
Sold by
Inks Selena A and Collins Selena A
Bought by
Inks Selena A and Inks Craig R
Current Estimated Value
Home Financials for this Owner
Home Financials are based on the most recent Mortgage that was taken out on this home.
Original Mortgage
$67,800
Outstanding Balance
$60,176
Interest Rate
3.5%
Mortgage Type
New Conventional
Estimated Equity
$65,167
Purchase Details
Closed on
Apr 14, 2020
Sold by
Collison Phillip D
Bought by
Inks Selena A and Colison Selena A
Home Financials for this Owner
Home Financials are based on the most recent Mortgage that was taken out on this home.
Original Mortgage
$67,800
Outstanding Balance
$60,176
Interest Rate
3.5%
Mortgage Type
New Conventional
Estimated Equity
$65,167
Purchase Details
Closed on
Nov 3, 2006
Sold by
Kupka William C and Kupka Cheri M
Bought by
Collison Phillip D and Collison Selena A
Home Financials for this Owner
Home Financials are based on the most recent Mortgage that was taken out on this home.
Original Mortgage
$76,410
Interest Rate
6.45%
Mortgage Type
Stand Alone First
Purchase Details
Closed on
Sep 1, 1986
Bought by
Collison Phillip D and Collison Selena A
Create a Home Valuation Report for This Property
The Home Valuation Report is an in-depth analysis detailing your home's value as well as a comparison with similar homes in the area
Home Values in the Area
Average Home Value in this Area
Purchase History
| Date | Buyer | Sale Price | Title Company |
|---|---|---|---|
| Inks Selena A | -- | None Available | |
| Inks Selena A | -- | City Title Of Erie Cnty Inc | |
| Collison Phillip D | -- | Firelands Abstract & Title A | |
| Collison Phillip D | $32,500 | -- |
Source: Public Records
Mortgage History
| Date | Status | Borrower | Loan Amount |
|---|---|---|---|
| Open | Inks Selena A | $67,800 | |
| Closed | Collison Phillip D | $76,410 |
Source: Public Records
Tax History Compared to Growth
Tax History
| Year | Tax Paid | Tax Assessment Tax Assessment Total Assessment is a certain percentage of the fair market value that is determined by local assessors to be the total taxable value of land and additions on the property. | Land | Improvement |
|---|---|---|---|---|
| 2024 | $1,048 | $28,460 | $5,990 | $22,470 |
| 2023 | $1,048 | $24,330 | $5,110 | $19,220 |
| 2022 | $941 | $24,330 | $5,110 | $19,220 |
| 2021 | $972 | $24,330 | $5,110 | $19,220 |
| 2020 | $915 | $22,050 | $5,110 | $16,940 |
| 2019 | $914 | $22,050 | $5,110 | $16,940 |
| 2018 | $916 | $22,050 | $5,110 | $16,940 |
| 2017 | $834 | $20,020 | $5,110 | $14,910 |
| 2016 | $734 | $20,020 | $5,110 | $14,910 |
| 2015 | $722 | $20,020 | $5,110 | $14,910 |
| 2014 | $792 | $20,940 | $5,010 | $15,930 |
| 2013 | $775 | $20,940 | $5,010 | $15,930 |
Source: Public Records
Map
Nearby Homes
- 322 4th St
- 230 N Pennsylvania Ave
- 714 E State St
- 433 Sandusky Ave
- 612 2nd St
- 533 Sandusky Ave Unit 535
- 340 340 Sandusky Ave
- 924 Birdseye Blvd
- 224 Sandusky Ave Unit 226
- 208 E State St
- 314 S Collinwood Blvd
- 906 Amsden Blvd
- 0 S Buchanan St
- 600 S Buchanan St
- 516 N Front St
- 1526 Sunrise Blvd
- 546 Oaklawn Ave
- 318 Ethan Dr
- 711 Bloom Rd
- 427 N Clover St