721 Colt Dr Findlay, OH 45840
Estimated Value: $334,000 - $350,000
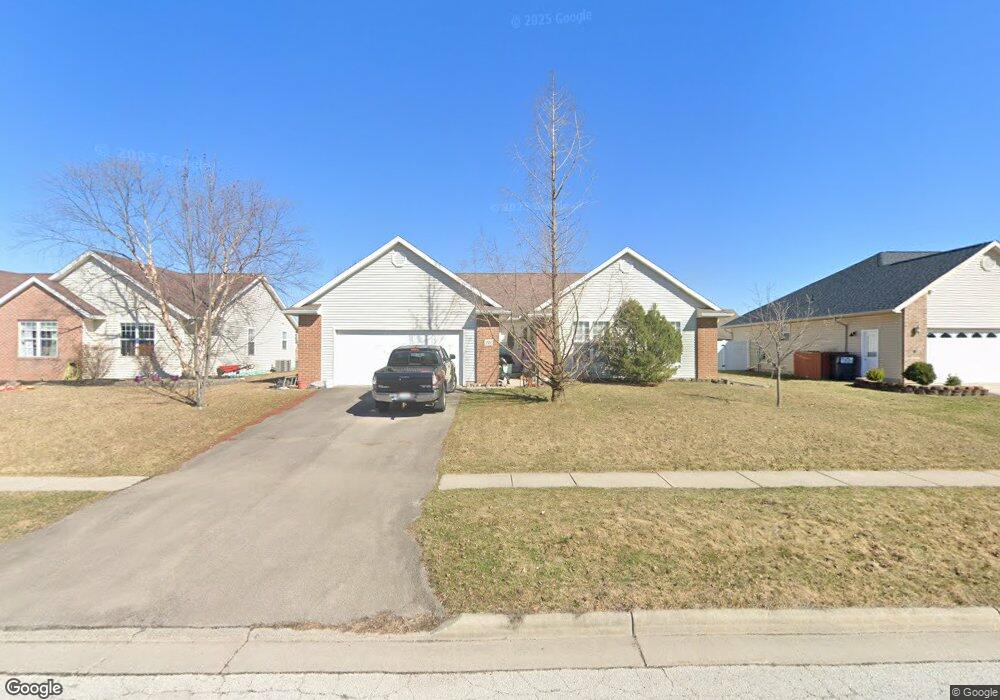
About This Home
This home is located at 721 Colt Dr, Findlay, OH 45840 and is currently estimated at $340,057, approximately $164 per square foot. 721 Colt Dr is a home located in Hancock County with nearby schools including Wilson Vance Elementary School, Whittier Elementary School, and Donnell Middle School.
Ownership History
We collect this data history from publicly available records. To have your information removed, we recommend requesting removal directly through your county’s website.
Purchase Details
Purchase Details
Purchase Details
Home Values in the Area
Average Home Value in this Area
Purchase History
We collect this data history from publicly available records. To have your information removed, we recommend requesting removal directly through your county’s website.
| Date | Buyer | Sale Price | Title Company |
|---|---|---|---|
| -- | Attorney | ||
| -- | -- | ||
| $177,733 | -- |
Tax History
We collect this data history from publicly available records. To have your information removed, we recommend requesting removal directly through your county’s website.
| Year | Tax Paid | Tax Assessment Tax Assessment Total Assessment is a certain percentage of the fair market value that is determined by local assessors to be the total taxable value of land and additions on the property. | Land | Improvement |
|---|---|---|---|---|
| 2025 | $2,995 | $97,690 | $15,070 | $82,620 |
| 2024 | $2,941 | $82,790 | $12,770 | $70,020 |
| 2023 | $2,946 | $82,790 | $12,770 | $70,020 |
| 2022 | $2,625 | $82,790 | $12,770 | $70,020 |
| 2021 | $2,439 | $68,620 | $11,930 | $56,690 |
| 2020 | $2,436 | $68,620 | $11,930 | $56,690 |
| 2019 | $2,387 | $68,620 | $11,930 | $56,690 |
| 2018 | $2,226 | $59,960 | $7,950 | $52,010 |
| 2017 | $1,113 | $59,960 | $7,950 | $52,010 |
| 2016 | $2,197 | $59,960 | $7,950 | $52,010 |
| 2015 | $2,245 | $60,100 | $8,440 | $51,660 |
| 2014 | $2,246 | $60,100 | $8,440 | $51,660 |
| 2012 | $2,546 | $66,550 | $8,440 | $58,110 |
Map
- 680 Colt Dr
- 505 Flintlock Ct
- 804 Hunters Creek Dr
- 1463 Misty Oaks Dr
- 1460 Timberwood Dr
- 522 Cranberry E
- 1210 South St
- 317 Mohican Rd
- 1105 1st St
- 300 Mohican Rd
- 15586 Canadian Way
- 0 Blanchard Ave
- 326 Pheasant Run Ln
- 1626 Imperial Ln
- 430 Fairway Rd
- 601 Winterberry Dr
- 1229 Leiser Ave
- 643 Center St
- 600 Woodworth Dr
- 1125 S Blanchard St
- 1405 Windermere Dr
- 1409 Windermere Dr
- 710 Tarra Oaks Dr
- 701 Colt Dr
- 711 Colt Dr
- 0 Lincoln St Unit 6001870
- 0 Lincoln St Unit 20170261
- 0 Lincoln St Unit lot 37 6001870
- 0 Lincoln St Unit 6001869
- 0 Lincoln St Unit 103796
- 0 Lincoln St Unit 103795
- 0 Lincoln St Unit H134089
- 0 Lincoln St Unit H134088
- 0 Lincoln St Unit H125992
- 0 Lincoln St Unit H125991
- 0 Lincoln St Unit H125978
- 0 Lincoln St Unit H125976
- 0 Lincoln St Unit H125975
- 720 Tarra Oaks Dr
- 701 Tarra Oaks Dr
Ask me questions while you tour the home.