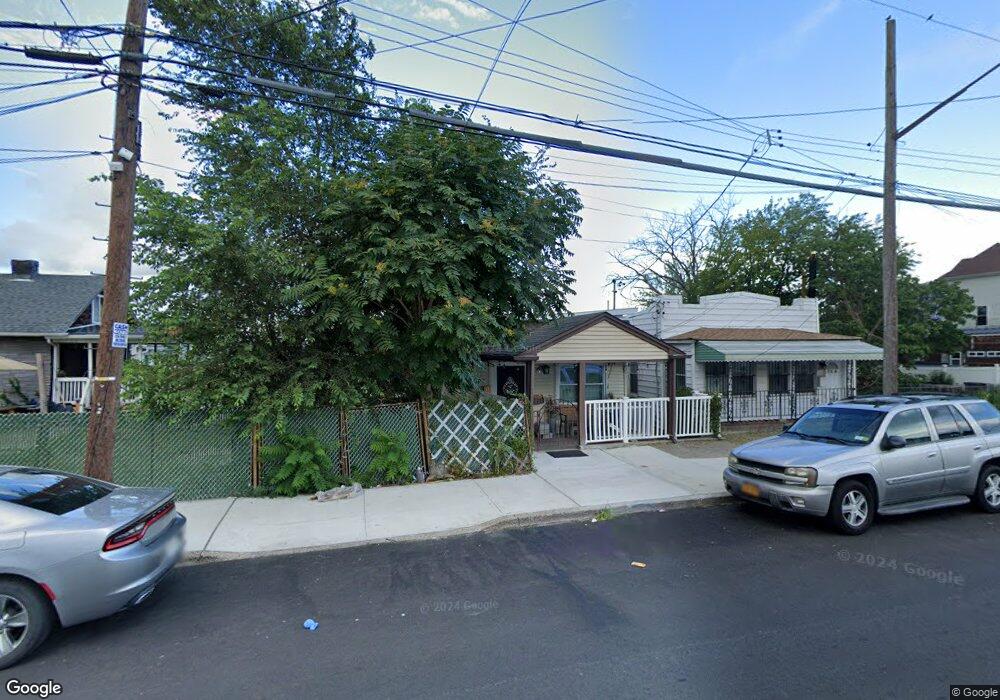
721 Drew St Unit Building Brooklyn, NY 11208
East New York NeighborhoodEstimated Value: $493,000 - $788,000
--
Bed
1
Bath
560
Sq Ft
$1,074/Sq Ft
Est. Value
About This Home
This home is located at 721 Drew St Unit Building, Brooklyn, NY 11208 and is currently estimated at $601,668, approximately $1,074 per square foot. 721 Drew St Unit Building is a home located in Kings County with nearby schools including P.S. 224 Hale A Woodruff, Van Siclen Community Middle School, and Our World Neighborhood Charter School 2.
Ownership History
Date
Name
Owned For
Owner Type
Purchase Details
Closed on
Jul 10, 2020
Sold by
Espinosa Yasiel and Ogando Carlos J
Bought by
Espinosa Yasiel and Ogando Carlos J
Current Estimated Value
Home Financials for this Owner
Home Financials are based on the most recent Mortgage that was taken out on this home.
Original Mortgage
$381,500
Outstanding Balance
$338,917
Interest Rate
3.2%
Mortgage Type
Unknown
Estimated Equity
$262,751
Purchase Details
Closed on
May 11, 2016
Sold by
Estate Of Richard Mosquera
Bought by
Espnosa Yasiel and Ogando Carlos J
Home Financials for this Owner
Home Financials are based on the most recent Mortgage that was taken out on this home.
Original Mortgage
$391,773
Interest Rate
3.59%
Mortgage Type
Purchase Money Mortgage
Create a Home Valuation Report for This Property
The Home Valuation Report is an in-depth analysis detailing your home's value as well as a comparison with similar homes in the area
Home Values in the Area
Average Home Value in this Area
Purchase History
| Date | Buyer | Sale Price | Title Company |
|---|---|---|---|
| Espinosa Yasiel | -- | -- | |
| Espnosa Yasiel | $399,000 | -- |
Source: Public Records
Mortgage History
| Date | Status | Borrower | Loan Amount |
|---|---|---|---|
| Open | Espinosa Yasiel | $381,500 | |
| Closed | Espnosa Yasiel | $391,773 |
Source: Public Records
Tax History Compared to Growth
Tax History
| Year | Tax Paid | Tax Assessment Tax Assessment Total Assessment is a certain percentage of the fair market value that is determined by local assessors to be the total taxable value of land and additions on the property. | Land | Improvement |
|---|---|---|---|---|
| 2025 | $2,770 | $34,380 | $10,380 | $24,000 |
| 2024 | $2,770 | $28,080 | $10,380 | $17,700 |
| 2023 | $2,648 | $34,440 | $10,380 | $24,060 |
| 2022 | $2,460 | $28,620 | $10,380 | $18,240 |
| 2021 | $2,450 | $22,080 | $10,380 | $11,700 |
| 2020 | $1,838 | $19,260 | $10,380 | $8,880 |
| 2019 | $2,404 | $19,260 | $10,380 | $8,880 |
| 2018 | $2,215 | $10,866 | $4,372 | $6,494 |
| 2017 | $2,093 | $10,268 | $4,775 | $5,493 |
| 2016 | $287 | $9,703 | $5,295 | $4,408 |
| 2015 | $114 | $9,703 | $5,946 | $3,757 |
| 2014 | $114 | $9,578 | $5,869 | $3,709 |
Source: Public Records
Map
Nearby Homes
- 1474 Blake Ave
- 1472 Blake Ave
- 439 Forbell St
- 13225 Ruby St
- 365 Forbell St
- 705 Eldert Ln Unit 709
- 133- 38 Amber St
- 133-155 77th St
- 1460 Sutter Ave
- 133-24 78th St
- 768 Lincoln Ave
- 772 Lincoln Ave
- 1394 Dumont Ave
- 778 Lincoln Ave
- 568 Drew St
- 10714 80th St
- 557 Drew St
- 7802 149th Ave
- 132-36 82nd St
- 132-20 82nd St