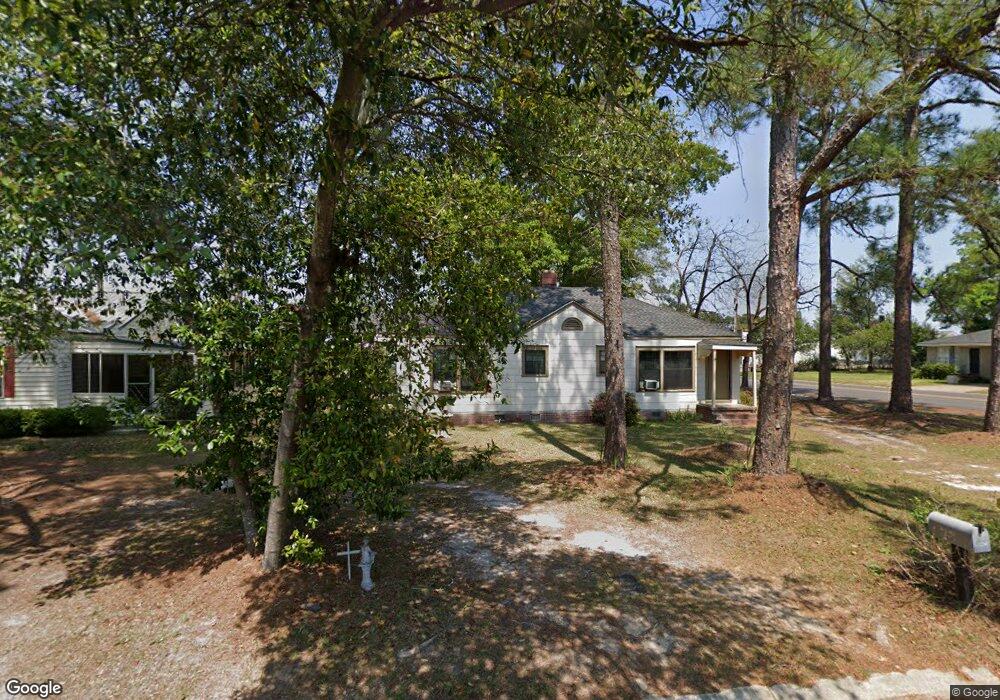
721 E 17th Ave Cordele, GA 31015
Estimated Value: $66,000 - $124,000
3
Beds
2
Baths
1,075
Sq Ft
$79/Sq Ft
Est. Value
About This Home
This home is located at 721 E 17th Ave, Cordele, GA 31015 and is currently estimated at $84,432, approximately $78 per square foot. 721 E 17th Ave is a home located in Crisp County with nearby schools including Crisp County Elementary School, Crisp County Primary School, and Crisp County Middle School.
Ownership History
Date
Name
Owned For
Owner Type
Purchase Details
Closed on
Oct 18, 2013
Sold by
Fachini Denise D
Bought by
Crenshaw Mark
Current Estimated Value
Purchase Details
Closed on
Jan 15, 2002
Sold by
Smith Ronnie G
Bought by
Fachini Denise D
Purchase Details
Closed on
Jun 30, 2000
Sold by
Wade Zack H
Bought by
Smith Ronnie G
Purchase Details
Closed on
Jun 25, 1973
Sold by
Floyd Annie F
Bought by
Wade Zack H
Purchase Details
Closed on
May 19, 1948
Bought by
Floyd Annie F
Create a Home Valuation Report for This Property
The Home Valuation Report is an in-depth analysis detailing your home's value as well as a comparison with similar homes in the area
Purchase History
| Date | Buyer | Sale Price | Title Company |
|---|---|---|---|
| Crenshaw Mark | $25,900 | -- | |
| Fachini Denise D | $41,500 | -- | |
| Smith Ronnie G | $32,500 | -- | |
| Wade Zack H | $11,500 | -- | |
| Floyd Annie F | -- | -- |
Source: Public Records
Tax History
| Year | Tax Paid | Tax Assessment Tax Assessment Total Assessment is a certain percentage of the fair market value that is determined by local assessors to be the total taxable value of land and additions on the property. | Land | Improvement |
|---|---|---|---|---|
| 2025 | $888 | $25,185 | $3,277 | $21,908 |
| 2024 | $825 | $23,018 | $3,277 | $19,741 |
| 2023 | $761 | $20,296 | $1,638 | $18,658 |
| 2022 | $508 | $19,212 | $1,638 | $17,574 |
| 2021 | $498 | $18,129 | $1,638 | $16,491 |
| 2020 | $510 | $18,129 | $1,638 | $16,491 |
| 2019 | $514 | $18,129 | $1,638 | $16,491 |
| 2018 | $465 | $15,766 | $3,113 | $12,653 |
| 2017 | $640 | $15,766 | $3,113 | $12,653 |
| 2016 | $466 | $15,766 | $3,113 | $12,653 |
| 2015 | -- | $15,766 | $3,113 | $12,653 |
| 2014 | -- | $15,766 | $3,113 | $12,653 |
| 2013 | -- | $15,766 | $3,112 | $12,653 |
Source: Public Records
Map
Nearby Homes
Your Personal Tour Guide
Ask me questions while you tour the home.