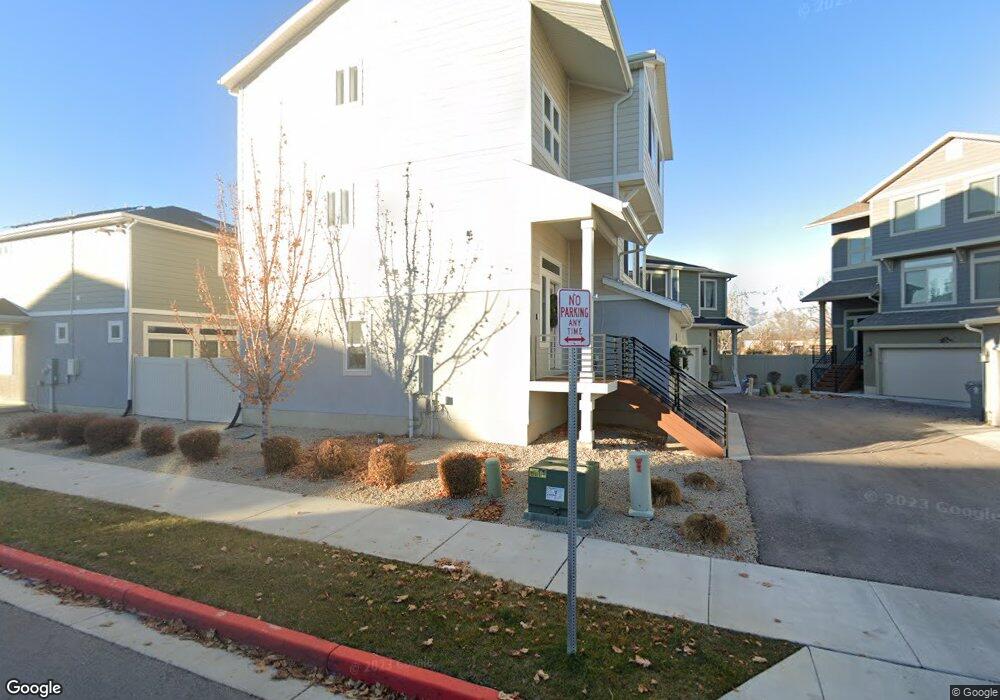
721 E 380 S American Fork, UT 84003
Estimated Value: $517,000 - $542,000
3
Beds
3
Baths
2,320
Sq Ft
$228/Sq Ft
Est. Value
About This Home
This home is located at 721 E 380 S, American Fork, UT 84003 and is currently estimated at $529,566, approximately $228 per square foot. 721 E 380 S is a home with nearby schools including American Fork Junior High School, American Fork High School, and Athenian eAcademy.
Ownership History
Date
Name
Owned For
Owner Type
Purchase Details
Closed on
Apr 20, 2020
Sold by
Madrigal Chase Edward and Madrigal Makenzie
Bought by
Madrigal Chase Edward and Madrigal Makenzie Briggs
Current Estimated Value
Home Financials for this Owner
Home Financials are based on the most recent Mortgage that was taken out on this home.
Original Mortgage
$160,700
Outstanding Balance
$142,090
Interest Rate
3.3%
Mortgage Type
New Conventional
Estimated Equity
$387,476
Purchase Details
Closed on
Nov 7, 2017
Sold by
Clayton Proepties Group Ii Inc
Bought by
Mardrigal Chase Edward and Mardrigal Makezie
Home Financials for this Owner
Home Financials are based on the most recent Mortgage that was taken out on this home.
Original Mortgage
$150,000
Interest Rate
3.94%
Mortgage Type
New Conventional
Purchase Details
Closed on
Jul 3, 2017
Sold by
Oakwood Homes Of Utah Llc
Bought by
Clatyon Properties Group Ii Inc and Oakwood Homes
Create a Home Valuation Report for This Property
The Home Valuation Report is an in-depth analysis detailing your home's value as well as a comparison with similar homes in the area
Home Values in the Area
Average Home Value in this Area
Purchase History
We collect this data history from publicly available records. To have your information removed, we recommend requesting removal directly through your county’s website.
| Date | Buyer | Sale Price | Title Company |
|---|---|---|---|
| Madrigal Chase Edward | -- | Inwest Title | |
| Mardrigal Chase Edward | -- | Bartlett Title Ins Agen | |
| Clatyon Properties Group Ii Inc | -- | Cottonwood Title Ins Agency |
Source: Public Records
Mortgage History
We collect this data history from publicly available records. To have your information removed, we recommend requesting removal directly through your county’s website.
| Date | Status | Borrower | Loan Amount |
|---|---|---|---|
| Open | Madrigal Chase Edward | $160,700 | |
| Closed | Mardrigal Chase Edward | $150,000 |
Source: Public Records
Tax History
| Year | Tax Paid | Tax Assessment Tax Assessment Total Assessment is a certain percentage of the fair market value that is determined by local assessors to be the total taxable value of land and additions on the property. | Land | Improvement |
|---|---|---|---|---|
| 2025 | $2,327 | $277,915 | -- | -- |
| 2024 | $2,327 | $258,500 | $0 | $0 |
| 2023 | $2,243 | $264,220 | $0 | $0 |
| 2022 | $2,327 | $270,490 | $0 | $0 |
| 2021 | $2,009 | $364,800 | $124,000 | $240,800 |
| 2020 | $1,919 | $337,900 | $110,700 | $227,200 |
| 2019 | $1,647 | $300,000 | $102,400 | $197,600 |
| 2018 | $1,601 | $278,800 | $91,300 | $187,500 |
| 2017 | $854 | $80,300 | $0 | $0 |
Source: Public Records
Map
Nearby Homes
Your Personal Tour Guide
Ask me questions while you tour the home.