721 E Market St Leesburg, VA 20176
Estimated Value: $6,664,331
--
Bed
--
Bath
35,554
Sq Ft
$187/Sq Ft
Est. Value
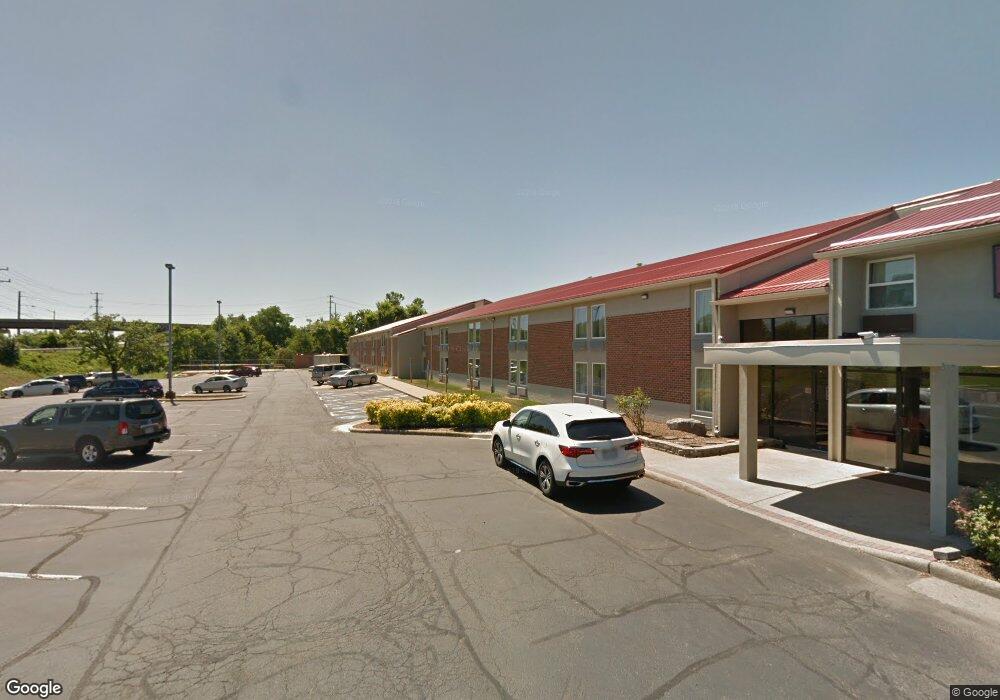
About This Home
This home is located at 721 E Market St, Leesburg, VA 20176 and is currently estimated at $6,664,331, approximately $187 per square foot. 721 E Market St is a home located in Loudoun County with nearby schools including Frederick Douglass Elementary School, J. Lupton Simpson Middle School, and Loudoun County High School.
Ownership History
Date
Name
Owned For
Owner Type
Purchase Details
Closed on
Jan 18, 2018
Sold by
Leesburg Hotel Associates Lc A Virginia
Bought by
Leesburg Invesments Iii Llc A Virginia L
Current Estimated Value
Home Financials for this Owner
Home Financials are based on the most recent Mortgage that was taken out on this home.
Original Mortgage
$3,953,600
Outstanding Balance
$3,336,369
Interest Rate
3.94%
Mortgage Type
Credit Line Revolving
Estimated Equity
$3,327,962
Create a Home Valuation Report for This Property
The Home Valuation Report is an in-depth analysis detailing your home's value as well as a comparison with similar homes in the area
Home Values in the Area
Average Home Value in this Area
Purchase History
| Date | Buyer | Sale Price | Title Company |
|---|---|---|---|
| Leesburg Invesments Iii Llc A Virginia L | $4,342,000 | Walker Title Llc |
Source: Public Records
Mortgage History
| Date | Status | Borrower | Loan Amount |
|---|---|---|---|
| Open | Leesburg Invesments Iii Llc A Virginia L | $3,953,600 |
Source: Public Records
Tax History Compared to Growth
Tax History
| Year | Tax Paid | Tax Assessment Tax Assessment Total Assessment is a certain percentage of the fair market value that is determined by local assessors to be the total taxable value of land and additions on the property. | Land | Improvement |
|---|---|---|---|---|
| 2025 | $33,321 | $4,139,220 | $1,600,000 | $2,539,220 |
| 2024 | $35,584 | $4,113,770 | $1,600,000 | $2,513,770 |
| 2023 | $30,909 | $3,532,480 | $1,600,000 | $1,932,480 |
| 2022 | $23,758 | $2,669,490 | $1,600,000 | $1,069,490 |
| 2021 | $15,680 | $1,600,000 | $1,600,000 | $0 |
| 2020 | $43,898 | $4,241,330 | $1,620,000 | $2,621,330 |
| 2019 | $44,945 | $4,300,920 | $1,620,000 | $2,680,920 |
| 2018 | $29,399 | $2,709,550 | $1,620,000 | $1,089,550 |
| 2017 | $24,053 | $2,138,040 | $1,620,000 | $518,040 |
| 2016 | $26,848 | $2,344,830 | $0 | $0 |
| 2015 | $5,089 | $1,160,730 | $0 | $1,160,730 |
| 2014 | $4,470 | $442,800 | $0 | $442,800 |
Source: Public Records
Map
Nearby Homes
- 101 Fort Evans Rd SE Unit F
- 118 Fort Evans Rd SE Unit C
- 251 Meadows Ln NE
- 589 Rockbridge Dr SE
- BIRKHALL Plan at Brickyard
- HIGHGROVE Plan at Brickyard
- BALMORAL Plan at Brickyard
- 135 Oak View Dr SE
- 214 Shenandoah St SE
- 678 Gateway Dr SE Unit 907
- 608 Blue Ridge Ave NE
- 134 Shirley Square SE
- 664 Gateway Dr SE Unit 314
- 265 High Rail Terrace SE
- 219 Chianti Terrace SE
- 229 Chianti Terrace SE
- 231 Chianti Terrace SE
- 233 Chianti Terrace SE
- 235 Chianti Terrace SE
- 218 Chianti Terrace SE
- 80 Prosperity Ave SE
- 707 E Market St
- 722 E Market St
- 714 E Market St
- 704 E Market St
- 5 Fort Evans Rd NE
- 701 E Market St
- 701 E Market St
- 701 E Market St
- 701 E Market St
- 701 E Market St
- 7 Fort Evans Rd NE
- 104 Prosperity Ave SE Unit A
- 104 Prosperity Ave SE Unit F
- 104 Prosperity Ave SE Unit B
- 104 Prosperity Ave SE Unit D
- 104 Prosperity Ave SE Unit C
- 104 Prosperity Ave SE Unit E
- 104 Prosperity Ave SE
- 104 Prosperity Ave SE Unit 190