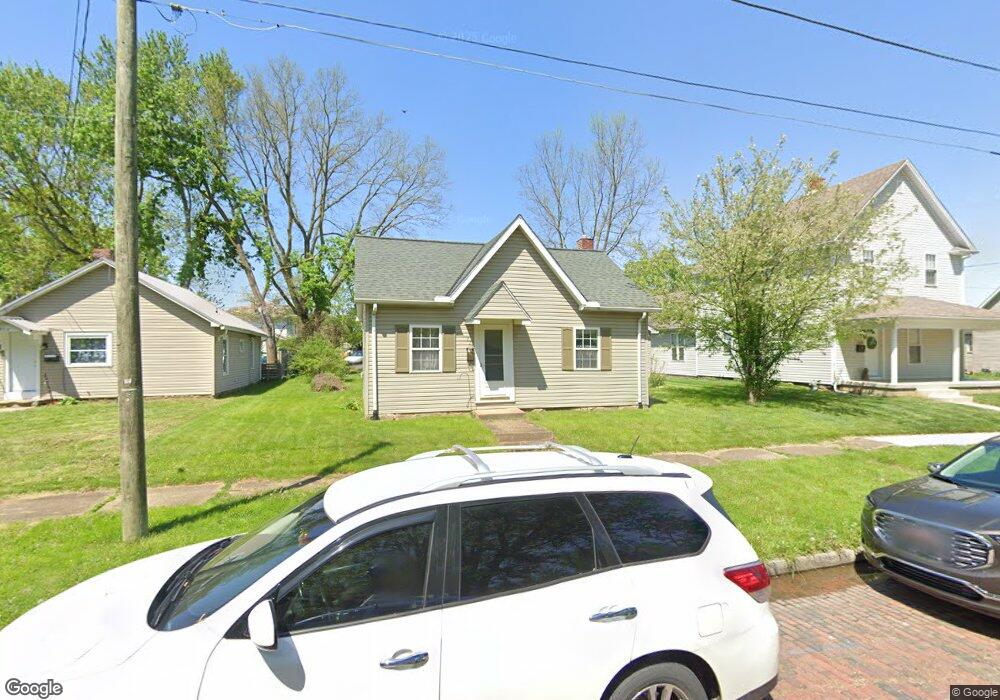
721 E Vine St Mount Vernon, OH 43050
Estimated Value: $161,000 - $204,000
2
Beds
1
Bath
1,052
Sq Ft
$168/Sq Ft
Est. Value
About This Home
This home is located at 721 E Vine St, Mount Vernon, OH 43050 and is currently estimated at $177,156, approximately $168 per square foot. 721 E Vine St is a home located in Knox County with nearby schools including Mount Vernon High School, St. Vincent de Paul School, and Christian Star Academy.
Ownership History
Date
Name
Owned For
Owner Type
Purchase Details
Closed on
Nov 15, 2001
Sold by
Blubaugh Jennifer N
Bought by
Proper Pepper
Current Estimated Value
Purchase Details
Closed on
Sep 1, 2000
Sold by
Gardner Timothy G and Gardner Bowma
Bought by
Blubaugh Jennifer N
Purchase Details
Closed on
Nov 3, 1998
Sold by
Stuller James M and Stuller Martha
Bought by
Gardner Timothy G and Gardner Bowma
Purchase Details
Closed on
Aug 24, 1990
Sold by
Hotchkiss John
Bought by
Stuller James M and Stuller Martha
Create a Home Valuation Report for This Property
The Home Valuation Report is an in-depth analysis detailing your home's value as well as a comparison with similar homes in the area
Home Values in the Area
Average Home Value in this Area
Purchase History
| Date | Buyer | Sale Price | Title Company |
|---|---|---|---|
| Proper Pepper | $66,000 | -- | |
| Blubaugh Jennifer N | $64,000 | -- | |
| Gardner Timothy G | $50,000 | -- | |
| Stuller James M | $11,000 | -- |
Source: Public Records
Tax History
| Year | Tax Paid | Tax Assessment Tax Assessment Total Assessment is a certain percentage of the fair market value that is determined by local assessors to be the total taxable value of land and additions on the property. | Land | Improvement |
|---|---|---|---|---|
| 2024 | $1,356 | $35,890 | $9,500 | $26,390 |
| 2023 | $1,387 | $35,890 | $9,500 | $26,390 |
| 2022 | $1,221 | $28,710 | $7,600 | $21,110 |
| 2021 | $1,221 | $28,710 | $7,600 | $21,110 |
| 2020 | $1,189 | $28,710 | $7,600 | $21,110 |
| 2019 | $1,267 | $28,550 | $10,260 | $18,290 |
| 2018 | $1,268 | $28,550 | $10,260 | $18,290 |
| 2017 | $1,245 | $28,550 | $10,260 | $18,290 |
| 2016 | $1,155 | $26,440 | $9,500 | $16,940 |
| 2015 | $1,160 | $26,440 | $9,500 | $16,940 |
| 2014 | $1,166 | $26,440 | $9,500 | $16,940 |
| 2013 | $1,204 | $25,950 | $9,870 | $16,080 |
Source: Public Records
Map
Nearby Homes
- 600 1/2 E Chestnut St
- 600 E Chestnut St Unit 1/2
- 501 Oak St
- 108 Ringold St
- 604 E Gambier St
- 655 Howard St
- 220 Coshocton Ave
- 900 E Gambier St
- 213 Coshocton Ave
- 418 E Pleasant St
- 104 N Park St
- 419 E Pleasant St
- 6 Edgewood Blvd
- 1 Hilltop Dr
- 208 E Burgess St
- 612 N Clinton St
- 12 3rd Ave
- 12 Third Ave
- 0 Miami St
- 6 Elliott St
Your Personal Tour Guide
Ask me questions while you tour the home.