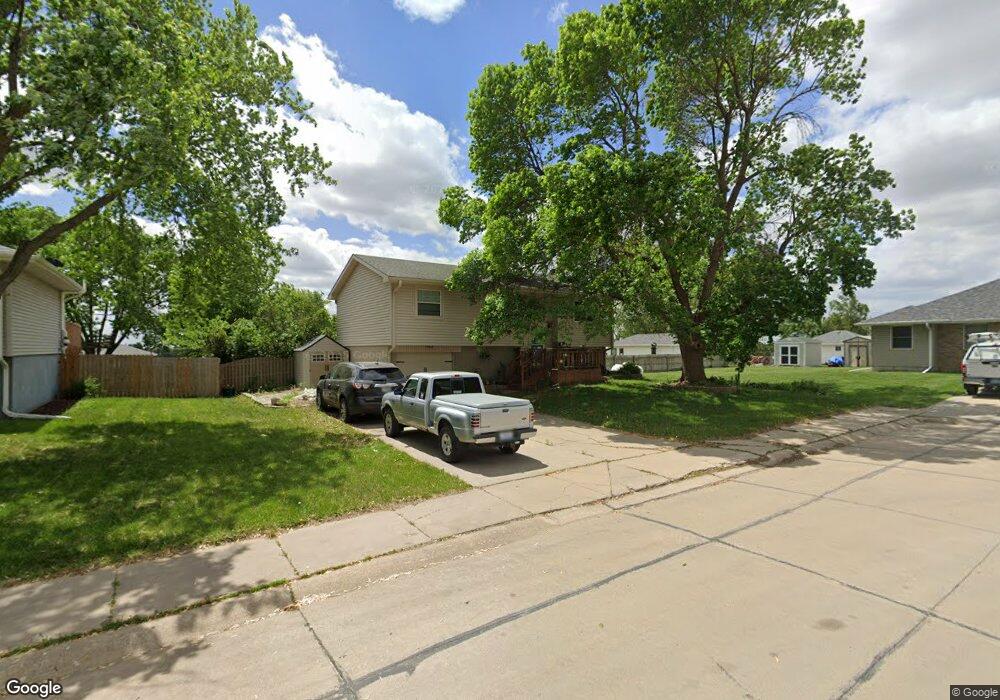
721 Elm St Ceresco, NE 68017
Estimated Value: $244,120 - $257,000
4
Beds
2
Baths
1,024
Sq Ft
$243/Sq Ft
Est. Value
About This Home
This home is located at 721 Elm St, Ceresco, NE 68017 and is currently estimated at $249,030, approximately $243 per square foot. 721 Elm St is a home located in Saunders County with nearby schools including Raymond Central High School.
Ownership History
Date
Name
Owned For
Owner Type
Purchase Details
Closed on
Oct 2, 2020
Sold by
Fallowfield Zachary I and Fallowfield Katie L
Bought by
Nightingale Jenny L
Current Estimated Value
Home Financials for this Owner
Home Financials are based on the most recent Mortgage that was taken out on this home.
Original Mortgage
$166,666
Outstanding Balance
$146,949
Interest Rate
2.8%
Mortgage Type
New Conventional
Estimated Equity
$102,081
Purchase Details
Closed on
May 12, 2017
Sold by
Hudson James M and Hudson Kimberly S
Bought by
Fallowfield Katie L and Fallowfield Zachary I
Create a Home Valuation Report for This Property
The Home Valuation Report is an in-depth analysis detailing your home's value as well as a comparison with similar homes in the area
Home Values in the Area
Average Home Value in this Area
Purchase History
| Date | Buyer | Sale Price | Title Company |
|---|---|---|---|
| Nightingale Jenny L | $165,000 | Charter Title & Escrow Servi | |
| Fallowfield Katie L | -- | Nebraska Land Title And Abst |
Source: Public Records
Mortgage History
| Date | Status | Borrower | Loan Amount |
|---|---|---|---|
| Open | Nightingale Jenny L | $166,666 |
Source: Public Records
Tax History Compared to Growth
Tax History
| Year | Tax Paid | Tax Assessment Tax Assessment Total Assessment is a certain percentage of the fair market value that is determined by local assessors to be the total taxable value of land and additions on the property. | Land | Improvement |
|---|---|---|---|---|
| 2025 | $2,623 | $181,856 | $28,500 | $153,356 |
| 2024 | $2,623 | $172,418 | $21,850 | $150,568 |
| 2023 | $2,965 | $167,156 | $21,850 | $145,306 |
| 2022 | $3,169 | $161,505 | $21,850 | $139,655 |
| 2021 | $2,666 | $132,946 | $21,850 | $111,096 |
| 2020 | $2,678 | $132,946 | $21,850 | $111,096 |
| 2019 | $2,562 | $126,220 | $21,850 | $104,370 |
| 2018 | $2,604 | $126,220 | $21,850 | $104,370 |
| 2017 | $2,330 | $113,450 | $21,850 | $91,600 |
| 2016 | $2,340 | $95,100 | $20,000 | $75,100 |
| 2015 | $2,032 | $95,100 | $20,000 | $75,100 |
| 2014 | $2,076 | $95,100 | $20,000 | $75,100 |
| 2012 | $2,386 | $95,100 | $20,000 | $75,100 |
Source: Public Records
Map
Nearby Homes
- 417 Main St
- 301 Ash St
- TBD Ash St
- 112 Spruce St
- 117 W Main St
- 2118 Wilsonville Rd
- 23300 N 14th St
- 2162 County Road A
- 8645 Agnew Rd
- 5830 Rock Creek Rd
- 135 Hunter St
- 120 Hunter St
- 8601 Agnew Lot 1 Rd
- 8601 Agnew Lot 4 Rd
- 8601 Agnew Lot 3 Rd
- 11629 Agnew Rd
- 0 County Road 13 & County Road B
- 1401 Raymond Rd
- 14 Raymond Rd
- 1470 County Road G