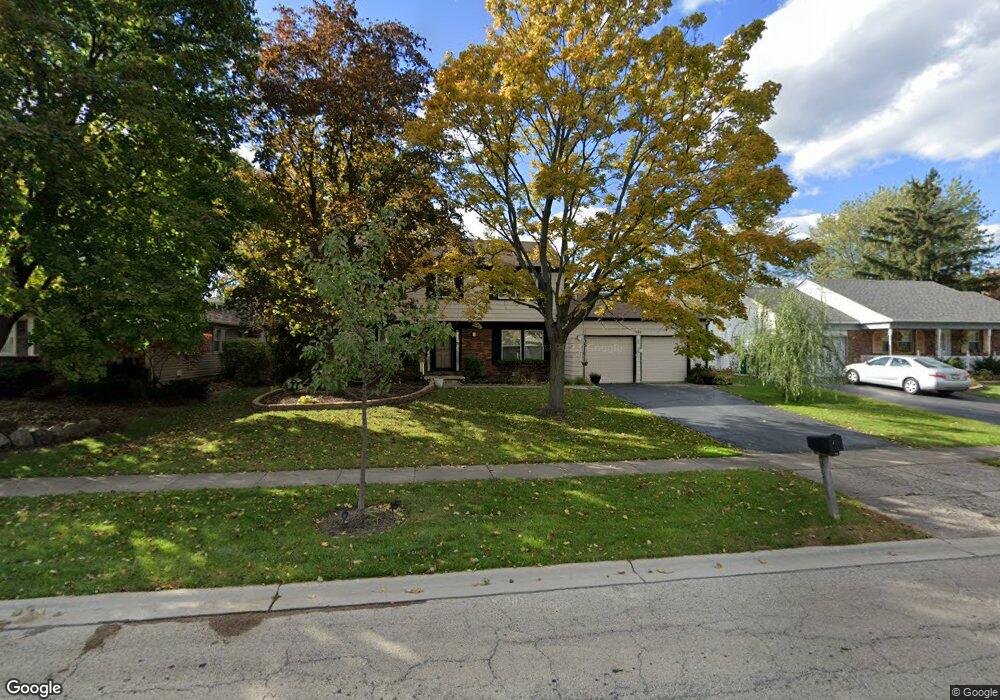
721 Indian Spring Ln Buffalo Grove, IL 60089
Estimated Value: $529,000 - $597,000
5
Beds
4
Baths
2,136
Sq Ft
$262/Sq Ft
Est. Value
About This Home
This home is located at 721 Indian Spring Ln, Buffalo Grove, IL 60089 and is currently estimated at $560,437, approximately $262 per square foot. 721 Indian Spring Ln is a home located in Lake County with nearby schools including Ivy Hall Elementary School, Twin Groves Middle School, and Adlai E Stevenson High School.
Ownership History
Date
Name
Owned For
Owner Type
Purchase Details
Closed on
Aug 14, 2008
Sold by
Pintel Alon and Oshri Deborah R
Bought by
Bhama Sanjeev and Bhama Neerja
Current Estimated Value
Home Financials for this Owner
Home Financials are based on the most recent Mortgage that was taken out on this home.
Original Mortgage
$333,500
Outstanding Balance
$219,850
Interest Rate
6.42%
Mortgage Type
Purchase Money Mortgage
Estimated Equity
$340,587
Purchase Details
Closed on
Apr 2, 2003
Sold by
Feldkamp Thomas N and Feldkamp Marilyn C
Bought by
Pintel Alon and Oshri Deborah R
Home Financials for this Owner
Home Financials are based on the most recent Mortgage that was taken out on this home.
Original Mortgage
$203,000
Interest Rate
5.71%
Mortgage Type
FHA
Create a Home Valuation Report for This Property
The Home Valuation Report is an in-depth analysis detailing your home's value as well as a comparison with similar homes in the area
Home Values in the Area
Average Home Value in this Area
Purchase History
| Date | Buyer | Sale Price | Title Company |
|---|---|---|---|
| Bhama Sanjeev | $417,000 | Ticor Title Insurance Co | |
| Pintel Alon | $329,000 | -- |
Source: Public Records
Mortgage History
| Date | Status | Borrower | Loan Amount |
|---|---|---|---|
| Open | Bhama Sanjeev | $333,500 | |
| Previous Owner | Pintel Alon | $203,000 |
Source: Public Records
Tax History Compared to Growth
Tax History
| Year | Tax Paid | Tax Assessment Tax Assessment Total Assessment is a certain percentage of the fair market value that is determined by local assessors to be the total taxable value of land and additions on the property. | Land | Improvement |
|---|---|---|---|---|
| 2024 | $13,605 | $149,045 | $33,966 | $115,079 |
| 2023 | $13,556 | $140,635 | $32,049 | $108,586 |
| 2022 | $13,556 | $136,008 | $30,994 | $105,014 |
| 2021 | $13,043 | $134,542 | $30,660 | $103,882 |
| 2020 | $12,735 | $135,001 | $30,765 | $104,236 |
| 2019 | $12,560 | $134,504 | $30,652 | $103,852 |
| 2018 | $11,365 | $125,986 | $30,293 | $95,693 |
| 2017 | $11,150 | $123,045 | $29,586 | $93,459 |
| 2016 | $10,858 | $117,825 | $28,331 | $89,494 |
| 2015 | $10,569 | $110,189 | $26,495 | $83,694 |
| 2014 | $9,573 | $99,012 | $28,456 | $70,556 |
| 2012 | $9,494 | $99,210 | $28,513 | $70,697 |
Source: Public Records
Map
Nearby Homes
- 800 Clohesey Dr
- 610 Checker Dr
- 12 Cloverdale Ct
- 950 Belmar Ln
- 931 Shady Grove Ln
- 1141 Devonshire Rd
- 711 Woodhollow Ln
- 887 Saybrook Ln Unit 2
- 390 Springside Ln
- 1325 Fairfax Ln
- 1032 Courtland Dr Unit 9
- 1324 Fairfax Ln Unit B32
- 1265 Devonshire Rd
- 1112 Auburn Ln
- 1514 Sumter Dr
- 746 Old Checker Rd Unit E5
- 221 Thornapple Ct
- 412 Chateau Dr
- 5107 N Arlington Heights Rd
- 1545 Chickamauga Ln
- 731 Indian Spring Ln
- 711 Indian Spring Ln
- 784 Clohesey Dr
- 812 Clohesey Dr
- 741 Indian Spring Ln
- 701 Indian Spring Ln
- 720 Indian Spring Ln
- 772 Clohesey Dr
- 710 Indian Spring Ln
- 824 Clohesey Dr
- 730 Indian Spring Ln
- 700 Indian Spring Ln
- 761 Indian Spring Ln
- 691 Indian Spring Ln
- 740 Indian Spring Ln Unit 9
- 760 Clohesey Dr
- 836 Clohesey Dr
- 690 Indian Spring Ln
- 731 Essington Ln
- 721 Essington Ln