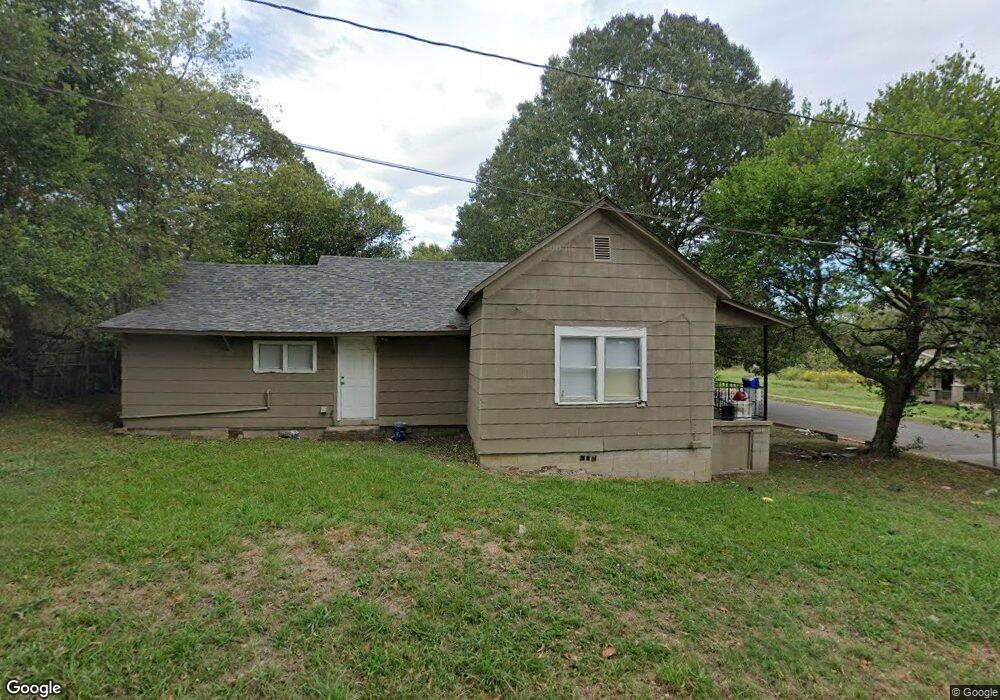
721 Lexington St Birmingham, AL 35224
Wylam NeighborhoodEstimated Value: $52,000 - $104,000
2
Beds
1
Bath
1,084
Sq Ft
$61/Sq Ft
Est. Value
About This Home
This home is located at 721 Lexington St, Birmingham, AL 35224 and is currently estimated at $65,881, approximately $60 per square foot. 721 Lexington St is a home with nearby schools including Wylam K8, Jackson-Olin High School, and Holy Family Elementary School.
Ownership History
Date
Name
Owned For
Owner Type
Purchase Details
Closed on
Feb 1, 2024
Sold by
Newrez Llc and Shellpoint Mortgage Servicing
Bought by
Nm Investments Llc
Current Estimated Value
Purchase Details
Closed on
Jan 22, 2008
Sold by
Helms Robert S and Helms Stephanie S
Bought by
Goodwin James R
Home Financials for this Owner
Home Financials are based on the most recent Mortgage that was taken out on this home.
Original Mortgage
$22,950
Interest Rate
6.06%
Mortgage Type
Purchase Money Mortgage
Purchase Details
Closed on
Jul 20, 1999
Sold by
Hodges George W
Bought by
Helms Robert S and Helms Stephanie S
Home Financials for this Owner
Home Financials are based on the most recent Mortgage that was taken out on this home.
Original Mortgage
$16,000
Interest Rate
7.66%
Mortgage Type
Seller Take Back
Create a Home Valuation Report for This Property
The Home Valuation Report is an in-depth analysis detailing your home's value as well as a comparison with similar homes in the area
Home Values in the Area
Average Home Value in this Area
Purchase History
| Date | Buyer | Sale Price | Title Company |
|---|---|---|---|
| Nm Investments Llc | $20,256 | None Listed On Document | |
| Goodwin James R | $25,500 | None Available | |
| Helms Robert S | $16,000 | Alabama Title Co Inc |
Source: Public Records
Mortgage History
| Date | Status | Borrower | Loan Amount |
|---|---|---|---|
| Previous Owner | Goodwin James R | $22,950 | |
| Previous Owner | Helms Robert S | $16,000 |
Source: Public Records
Tax History Compared to Growth
Tax History
| Year | Tax Paid | Tax Assessment Tax Assessment Total Assessment is a certain percentage of the fair market value that is determined by local assessors to be the total taxable value of land and additions on the property. | Land | Improvement |
|---|---|---|---|---|
| 2024 | $441 | $6,080 | -- | -- |
| 2022 | $342 | $4,720 | $1,200 | $3,520 |
| 2021 | $342 | $4,720 | $1,200 | $3,520 |
| 2020 | $342 | $4,720 | $1,200 | $3,520 |
| 2019 | $342 | $4,720 | $0 | $0 |
| 2018 | $297 | $4,100 | $0 | $0 |
| 2017 | $297 | $4,100 | $0 | $0 |
| 2016 | $297 | $4,100 | $0 | $0 |
| 2015 | $297 | $4,100 | $0 | $0 |
| 2014 | $348 | $4,060 | $0 | $0 |
| 2013 | $348 | $4,060 | $0 | $0 |
Source: Public Records
Map
Nearby Homes