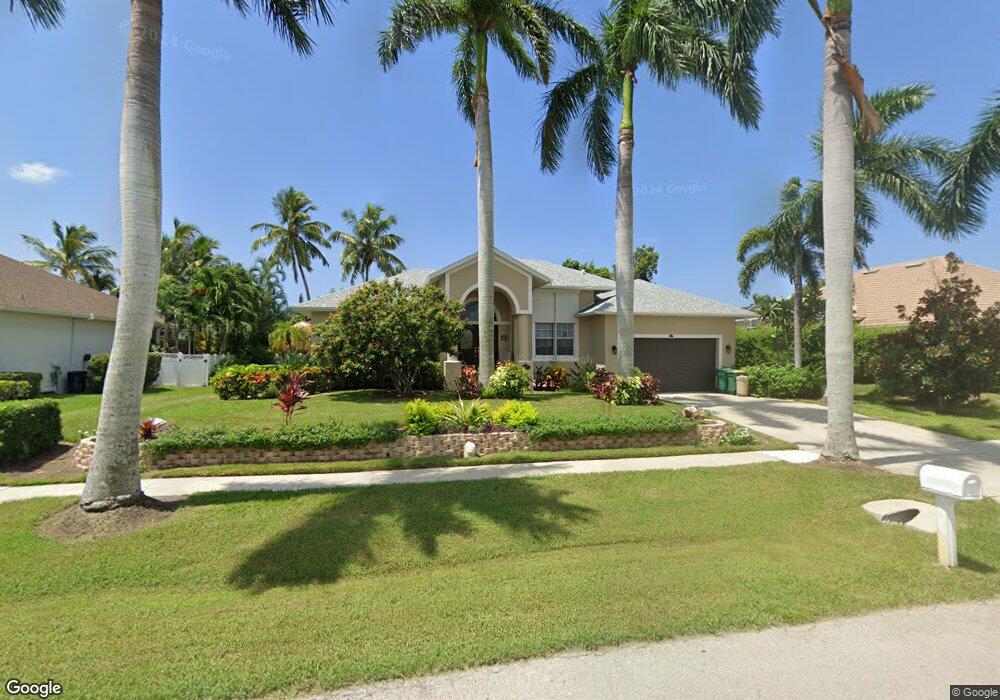
721 Lime Terrace Marco Island, FL 34145
Estimated Value: $957,809 - $1,343,000
3
Beds
2
Baths
2,200
Sq Ft
$528/Sq Ft
Est. Value
About This Home
This home is located at 721 Lime Terrace, Marco Island, FL 34145 and is currently estimated at $1,160,952, approximately $527 per square foot. 721 Lime Terrace is a home located in Collier County with nearby schools including Tommie Barfield Elementary School, Manatee Middle School, and Lely High School.
Ownership History
Date
Name
Owned For
Owner Type
Purchase Details
Closed on
Aug 29, 2000
Sold by
Trend Display Inc
Bought by
Barbour Matthew F and Barbour Shirley A
Current Estimated Value
Home Financials for this Owner
Home Financials are based on the most recent Mortgage that was taken out on this home.
Original Mortgage
$50,000
Outstanding Balance
$18,314
Interest Rate
8.17%
Estimated Equity
$1,142,638
Purchase Details
Closed on
May 26, 1998
Sold by
Sieberger Roswitha and Sieberger Willi
Bought by
Trend Display Inc
Purchase Details
Closed on
Apr 16, 1997
Sold by
Davis Margaret G
Bought by
Sieberger Roswitha
Create a Home Valuation Report for This Property
The Home Valuation Report is an in-depth analysis detailing your home's value as well as a comparison with similar homes in the area
Home Values in the Area
Average Home Value in this Area
Purchase History
| Date | Buyer | Sale Price | Title Company |
|---|---|---|---|
| Barbour Matthew F | $352,500 | -- | |
| Trend Display Inc | $310,000 | -- | |
| Sieberger Roswitha | $35,000 | -- |
Source: Public Records
Mortgage History
| Date | Status | Borrower | Loan Amount |
|---|---|---|---|
| Open | Barbour Matthew F | $50,000 |
Source: Public Records
Tax History Compared to Growth
Tax History
| Year | Tax Paid | Tax Assessment Tax Assessment Total Assessment is a certain percentage of the fair market value that is determined by local assessors to be the total taxable value of land and additions on the property. | Land | Improvement |
|---|---|---|---|---|
| 2025 | $2,989 | $347,535 | -- | -- |
| 2024 | $2,985 | $337,741 | -- | -- |
| 2023 | $2,985 | $329,684 | $0 | $0 |
| 2022 | $3,081 | $320,082 | $0 | $0 |
| 2021 | $3,170 | $310,759 | $0 | $0 |
| 2020 | $3,107 | $306,468 | $0 | $0 |
| 2019 | $3,081 | $299,578 | $0 | $0 |
| 2018 | $3,016 | $293,992 | $0 | $0 |
| 2017 | $2,979 | $287,945 | $0 | $0 |
| 2016 | $2,939 | $282,023 | $0 | $0 |
| 2015 | $2,994 | $280,063 | $0 | $0 |
| 2014 | $2,995 | $227,840 | $0 | $0 |
Source: Public Records
Map
Nearby Homes