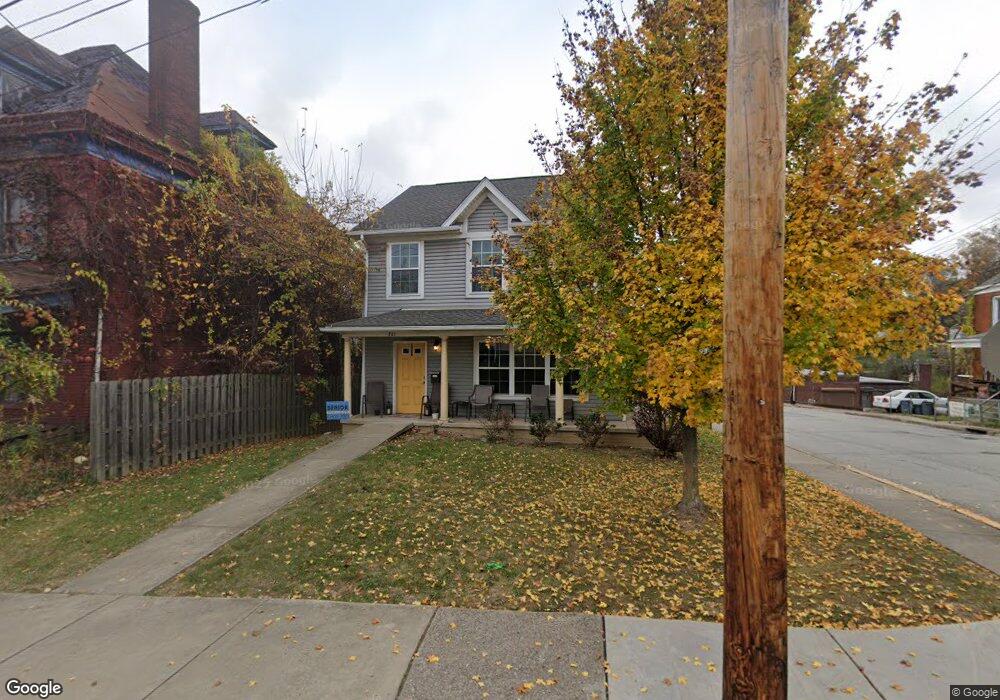
721 Middle St Braddock, PA 15104
North Braddock NeighborhoodEstimated Value: $87,000 - $142,000
3
Beds
2
Baths
1,596
Sq Ft
$78/Sq Ft
Est. Value
About This Home
This home is located at 721 Middle St, Braddock, PA 15104 and is currently estimated at $125,157, approximately $78 per square foot. 721 Middle St is a home with nearby schools including Woodland Hills Senior High School, The Western Pennsylvania School for the Deaf, and Braddock Hills High School.
Ownership History
Date
Name
Owned For
Owner Type
Purchase Details
Closed on
Oct 19, 2010
Sold by
Mon Valley Initiative
Bought by
Caldwell Verneer A
Current Estimated Value
Home Financials for this Owner
Home Financials are based on the most recent Mortgage that was taken out on this home.
Original Mortgage
$60,189
Outstanding Balance
$39,799
Interest Rate
4.39%
Mortgage Type
FHA
Estimated Equity
$85,358
Create a Home Valuation Report for This Property
The Home Valuation Report is an in-depth analysis detailing your home's value as well as a comparison with similar homes in the area
Home Values in the Area
Average Home Value in this Area
Purchase History
| Date | Buyer | Sale Price | Title Company |
|---|---|---|---|
| Caldwell Verneer A | $92,500 | -- |
Source: Public Records
Mortgage History
| Date | Status | Borrower | Loan Amount |
|---|---|---|---|
| Open | Caldwell Verneer A | $60,189 |
Source: Public Records
Tax History
| Year | Tax Paid | Tax Assessment Tax Assessment Total Assessment is a certain percentage of the fair market value that is determined by local assessors to be the total taxable value of land and additions on the property. | Land | Improvement |
|---|---|---|---|---|
| 2025 | $2,238 | $53,000 | $7,400 | $45,600 |
| 2024 | $2,238 | $53,000 | $7,400 | $45,600 |
| 2023 | $2,265 | $53,000 | $7,400 | $45,600 |
| 2022 | $2,265 | $53,000 | $7,400 | $45,600 |
| 2021 | $2,264 | $53,000 | $7,400 | $45,600 |
| 2020 | $2,218 | $53,000 | $7,400 | $45,600 |
| 2019 | $2,177 | $53,000 | $7,400 | $45,600 |
| 2017 | $2,177 | $53,000 | $7,400 | $45,600 |
Source: Public Records
Map
Nearby Homes
Your Personal Tour Guide
Ask me questions while you tour the home.